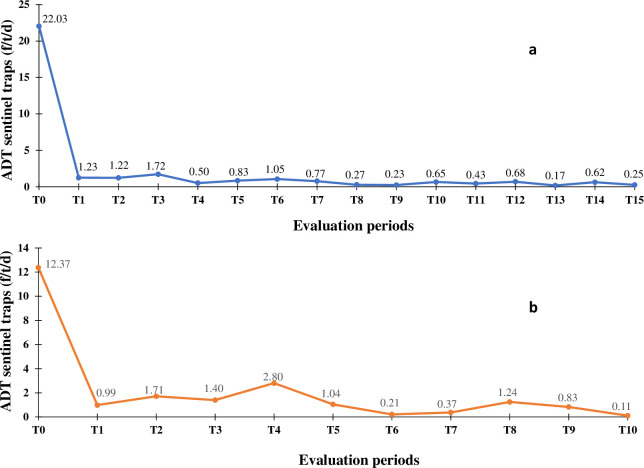
Fig 6. Evolution of the tsetse apparent density per trap during the entomological evaluations.
a. Evolution of the tsetse apparent density per trap during the entomological evaluations from T0 (June 2015) to T15 (December 2019) in the Bouaflé health district (Bonon focus). b. Evolution of the tsetse apparent density per trap during the entomological evaluations from T0 (November 2016) to T10 (December 2019) in the Sinfra health district. ADT = Apparent Density per Trap; f/t/d = tsetse flies/trap/day.

