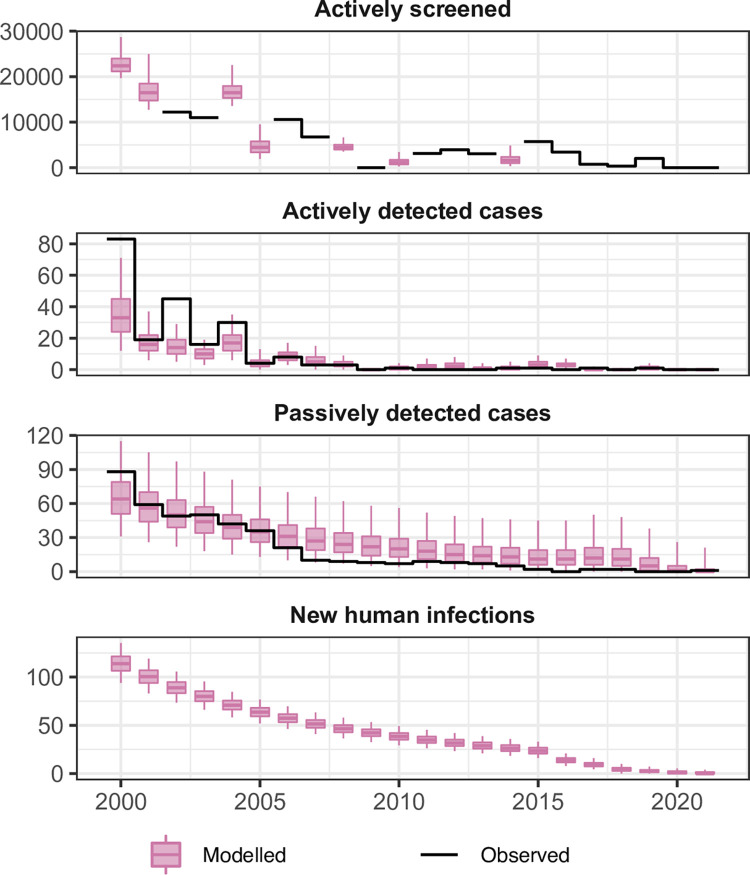
Fig 7. Aggregate fits to the data from Bouaflé, Sinfra, Oumé and Daloa health districts between 2000–2021.
The black lines show the observed data (either number of people screened or cases) and the pink box and whisker plots show the deterministic model with stochastic sampling (centre line is the median, boxes contain 50% credible intervals (CIs) and whiskers show 95% CIs). Some years of data are missing the total number of people actively screened so this was estimated during fitting with results shown as box and whiskers. New infections are not directly observable and are estimated through the model based on case reporting.

