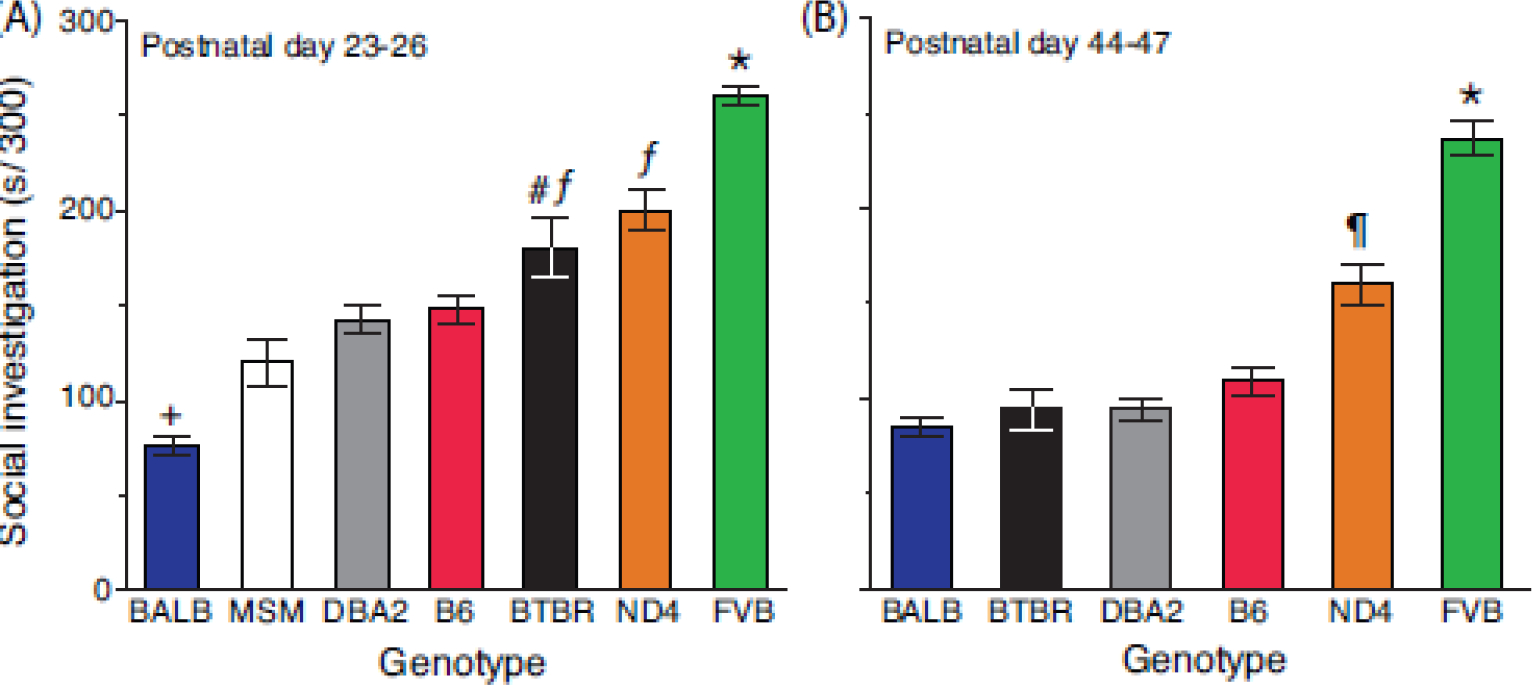
Figure 2.

Strain differences in social investigation. Sociability testing was conducted during (A) early and (B) late adolescence. Mice were monitored for 300 s. Data are presented as the mean ± std. error. Genotypes are arranged on the abscissa using the rank-order of means for SI. N=25–40 mice per genotype (balanced across sex) for each time point. N=12 mice for MSM. * = FVB > all other strains, P<0.0001; ƒ = ND4/BTBR > B6/DBA2/MSM/BALB, P<0.0001; # = BTBR > B6, P=0.01; ¶ = ND4 > B6/DBA2/MSM/BTBR/BALB, P<0.0001; + = BALB < all other strains, P<0.0001.
