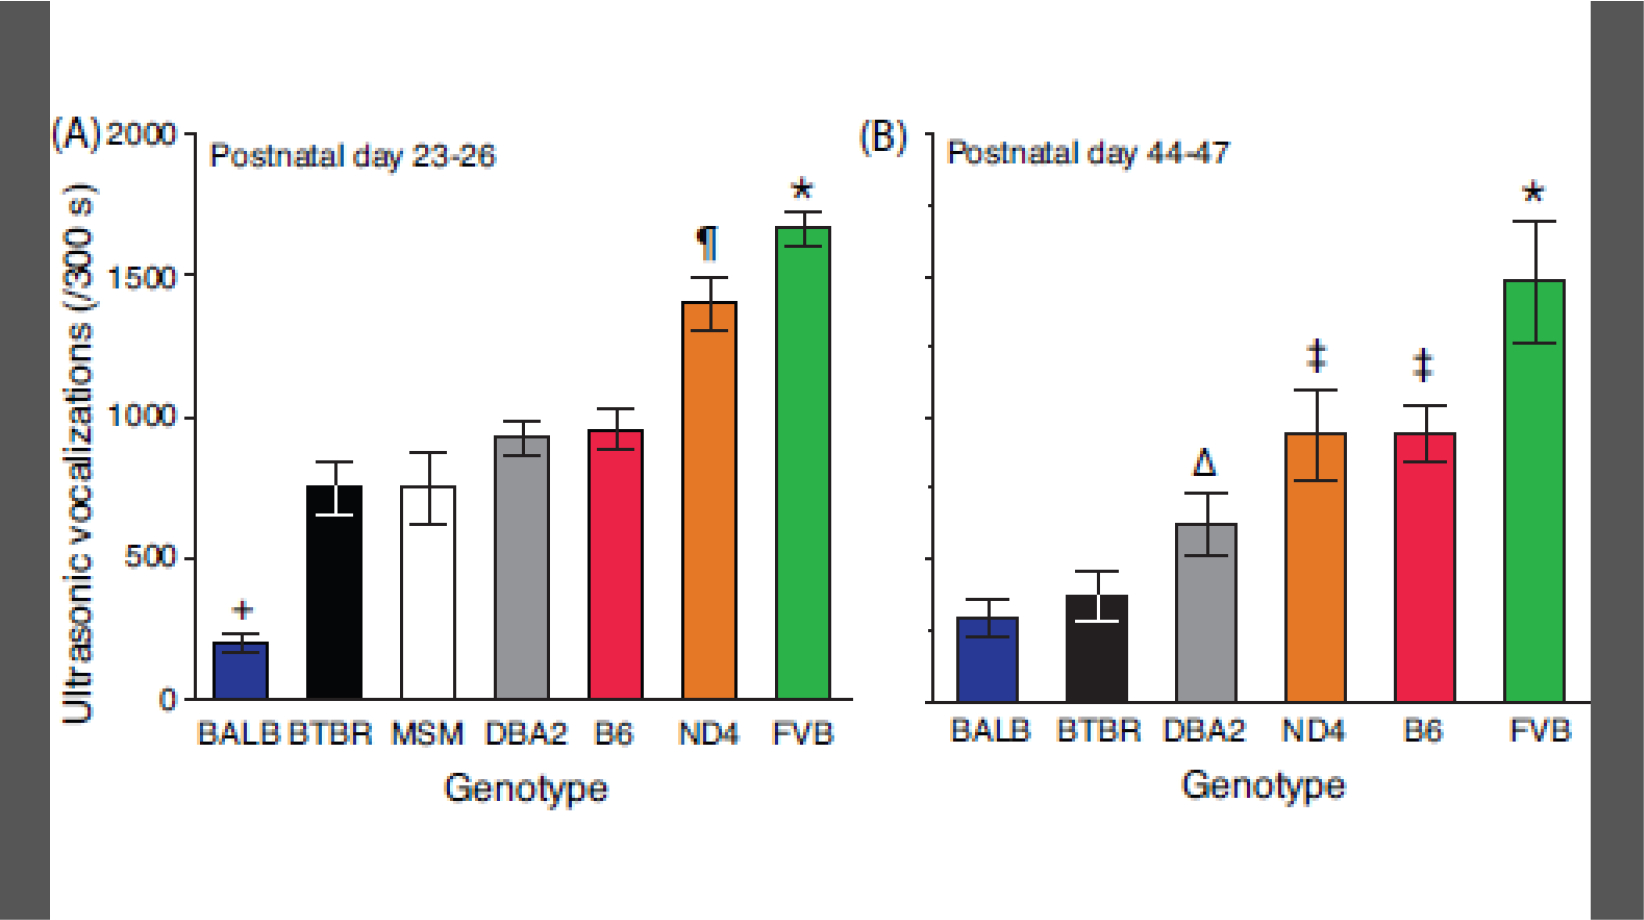
Figure 4.

Strain differences in ultrasonic vocalization emission. USV production was monitored during sociability testing on (A) PD 23–26 and (B) PD 44–47. Mice were monitored for 300 s. Data are presented as the mean ± std. error. Genotypes are arranged on the abscissa using the rank-order of means for USV production. N=19–40 mice per genotype (balanced across sex) for each time point. N=12 for MSM. * = FVB > all other strains; = ND4 > B6/DBA2/MSM/BTBR/BALB, P<0.0001; ‡ = B6/ND4 > DBA2, P<0.0001; Δ = DBA2 > BTBR/BALB, P=0.0007; + = BALB < all other strains, P<0.0001.
