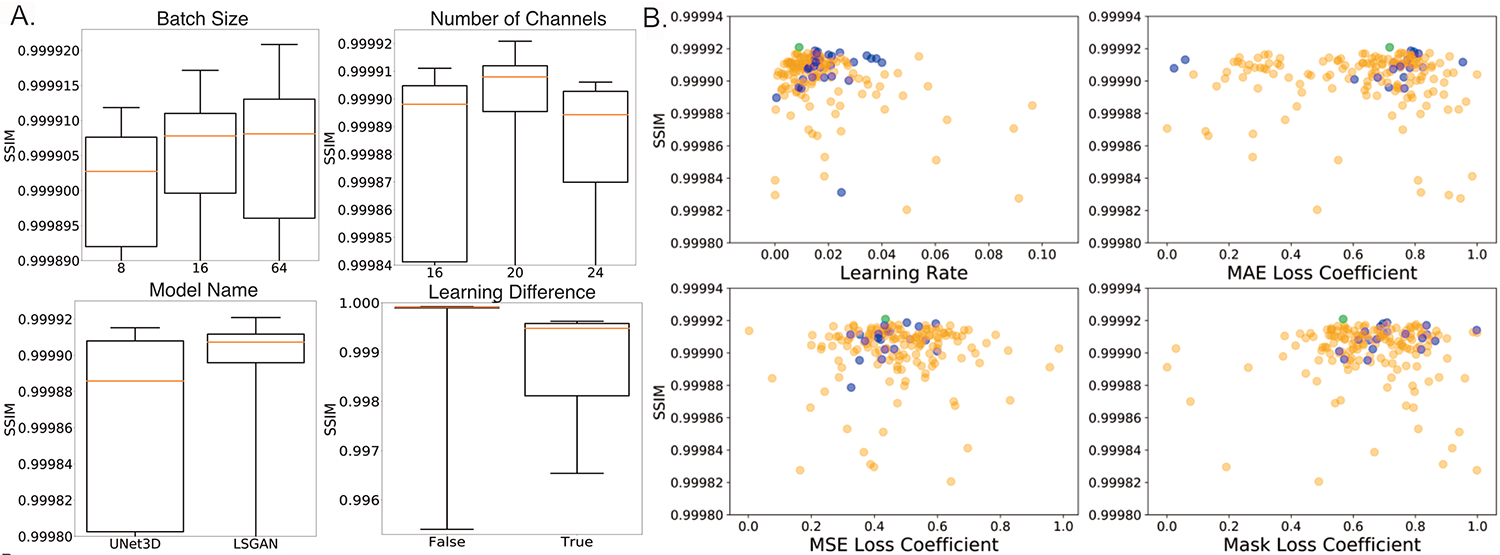
Figure 4. SSIM values across the hyperparameter search space.

A. Categorical hyperparameters and corresponding SSIM between CMB-masked predicted and original SWI in the validation set. B. Continuous hyperparameters and corresponding SSIM values. Each dot corresponds to a different trial in the optimization process. Blue dots represent the experiments when other hyperparameters are in the range of high SSIM yielding values whereas light green dot represent the best experiment among all experiments.
