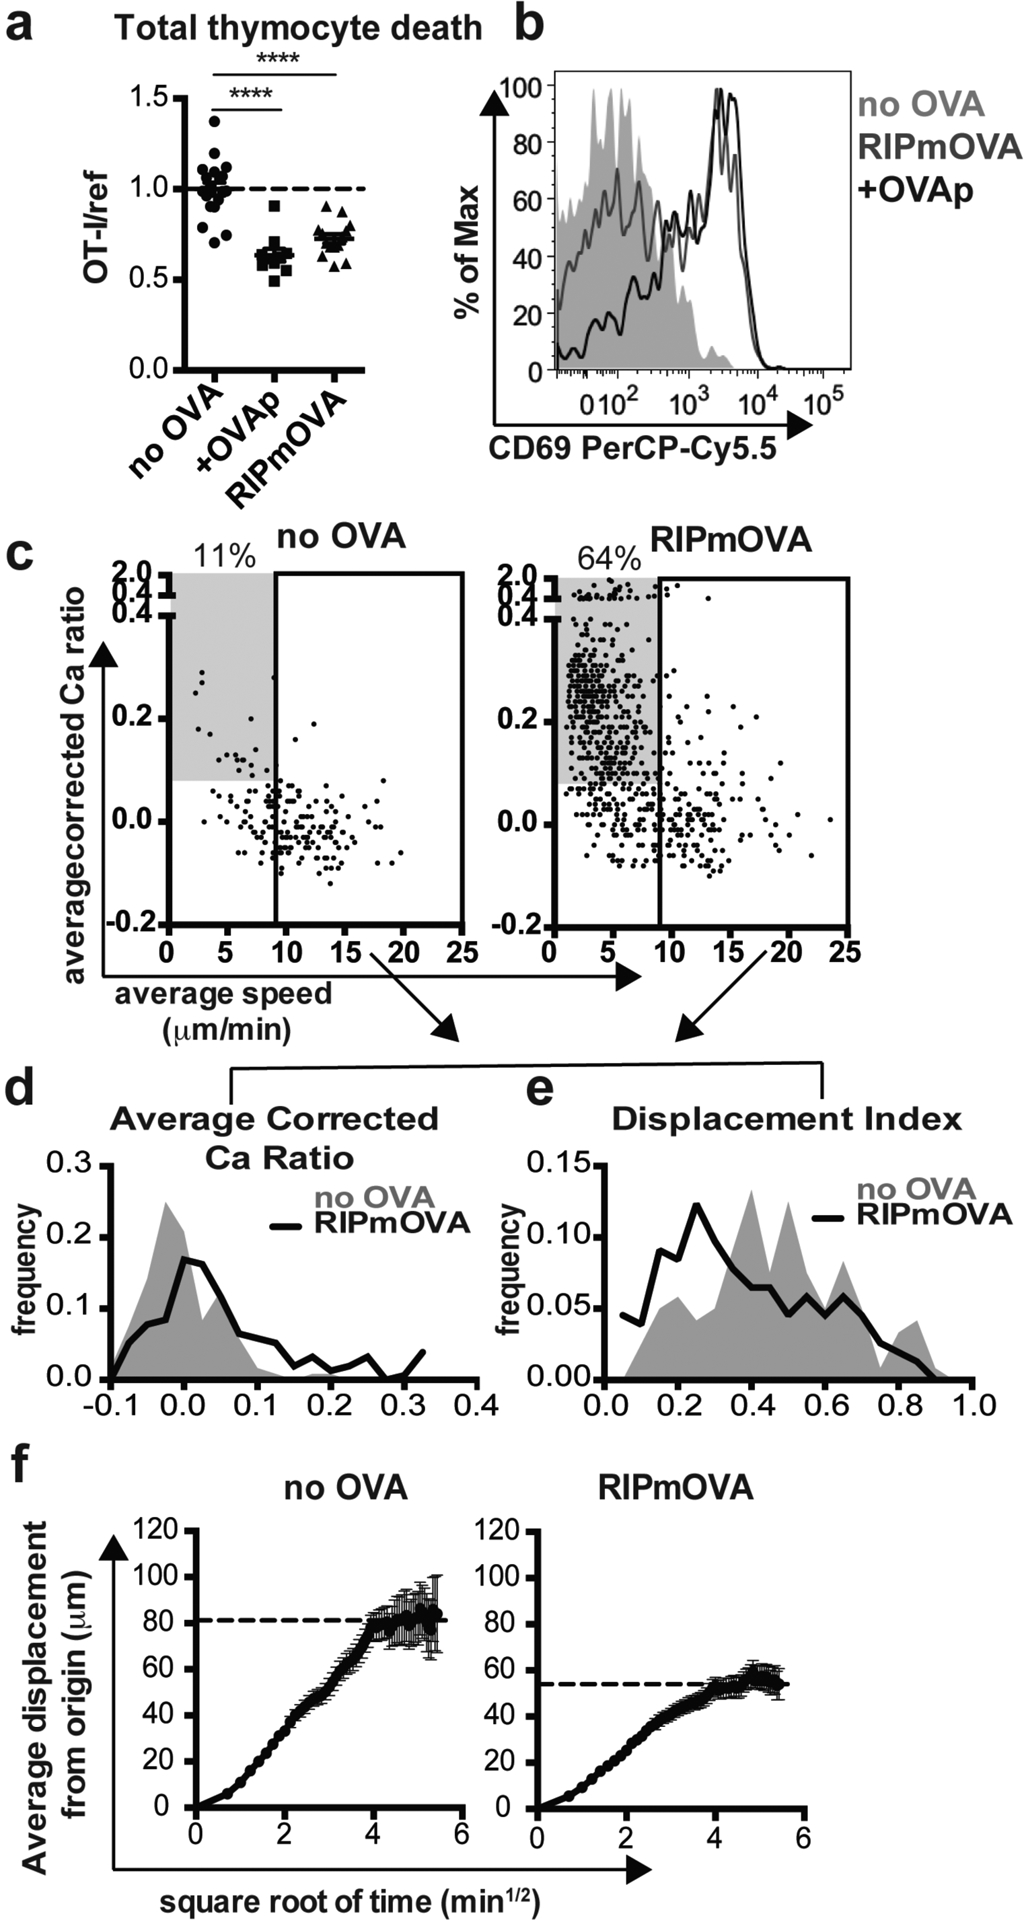
Figure 1. A proportion of OT-I thymocytes survive negative selection, and exhibit confined migration.

(a,b) Total OT-I thymocytes were overlaid onto the indicated thymic slices with reference thymocytes, and slices were harvested after 16 hours for flow cytometric analysis. (a) Negative selection displayed as the ratio of live OT-I thymocytes relative to live reference thymocytes, normalized to no OVA controls. (b) CD69 expression on gated OT-I thymocytes. Data are representative of (b) or pooled from (a) 4 independent experiments, with mean and SEM of n=19–20 thymic slices, where each dot represents an individual slice. ****p<0.0001 (one-way ANOVA with Bonferroni’s correction). (c-f) OT-I thymocytes were depleted of mature CD8 single positives (Supplementary Figure S1) and labeled with the fluorescent ratiometric calcium indicator dye Indo-1 LR prior to overlay on WT or RIPmOVA thymic slices. Thymocytes were allowed to migrate into slices for 2 hours, then imaged by two-photon microscopy 0–7 hours later. Data are pooled from 4 (RIPmOVA) or 2 (WT) imaging runs. (c) Average speed versus relative calcium (calculated as described in Materials and Methods) where each dot represents an individual thymocyte track (RIPmOVA, n=757; WT, n=188). Numbers indicate the % of tracked thymocytes with low speed and high calcium tracks (grey box: average speed<9 μm/min and average corrected calcium>0.08). Solid rectangle represents cutoff for fast tracks (average speed>9μm/min) used for the plots shown in d-f (d-e) Average corrected calcium ratio (d) and displacement index (e) of fast (>9 microns/minute) tracks, where n=154 (RIPmOVA) or 120 (WT) tracks. (f) Average displacement versus the square root of time for fast (>9 microns/minute) tracks on WT or RIPmOVA thymic slices. Black dotted lines indicate estimated plateau of confined migration, and error bars indicate SEM.
