. 2023 Aug 22;12:e82210. doi: 10.7554/eLife.82210

Figure 2. Phenformin treatment of C. elegans leads to increased abundance of multiple alkyl and alkenyl ether lipids.

(A–B) Loss-of-function fard-1 mutants have significant reduction in 18:0 fatty alcohols derivatized from 18-carbon containing alkenyl ether lipids (dimethylacetal [DMA]) by gas chromatography/mass spectrometry (GC/MS) (A) and accumulation of the saturated fatty acid stearate (18:0, B). (C) Wild-type (wt) worms treated with 4.5 mM phenformin display a significant increase in 18:0 DMA relative to vehicle control, indicative of higher levels of alkenyl ether lipids, with levels remaining essentially undetectable in fard-1 mutants on vehicle or drug. (D) Phenformin (4.5 mM) treatment does not impact stearate levels in wt worms, however it does result in a greater accumulation of stearate in fard-1 mutants. For (A–D), **, p<0.01; ****, p<0.0001, by t-test (A–B) or two-way ANOVA (C–D), n=3 biological replicates. (E) Phenformin (4.5 mM) treatment results in a significant increase in 16:0 DMA and 18:1 DMA in wt worms, relative to vehicle-treated controls *, p<0.05; **, p<0.01, by multiple t-tests, with two-stage linear step-up procedure of Benjamini, Krieger, and Yekutieli. n=3 biological replicates. (F) Heatmap of normalized ether lipid abundance following phenformin treatment in wt C. elegans indicates an overall increase in ether lipids relative to vehicle-treated controls, and this shift is absent in ether lipid deficient mutants. All metabolites shown have an FDR adjusted p<0.05 by one-way ANOVA followed by Fisher’s LSD post hoc testing for wt versus fard-1, ads-1, and acl-7 mutants. (G) Liquid chromatography-tandem mass spectrometry (LC-MS) analysis shows that phosphatidylethanolamine-containing ether lipids detected exhibited a general trend toward increased abundance in wild-type worms treated with 4.5 mM phenformin. Four of these ether lipids reached statistical significance: PE(O-16:0/18:1), PE(O-18:0/18:3), PE(O-18:0/20:2), and PE(P-18:1/18:1). Eleven of the ether lipids detected are of the alkyl-type (indicated by ‘O’ in their name prior to fatty alcohol designation) whereas nine are of the alkenyl-type (plasmalogen, indicated by ‘P’ in their name prior to the fatty alcohol designation) ether lipids. For (G), *, p<0.05; **, p<0.01; ****, p<0.0001, by multiple t-tests, with multiple hypothesis testing correction by two-stage step-up method of Benjamini, Krieger, and Yekutieli, n=3 biological replicates. See Figure 2—source data 1 for raw and normalized mass spectrometry data.

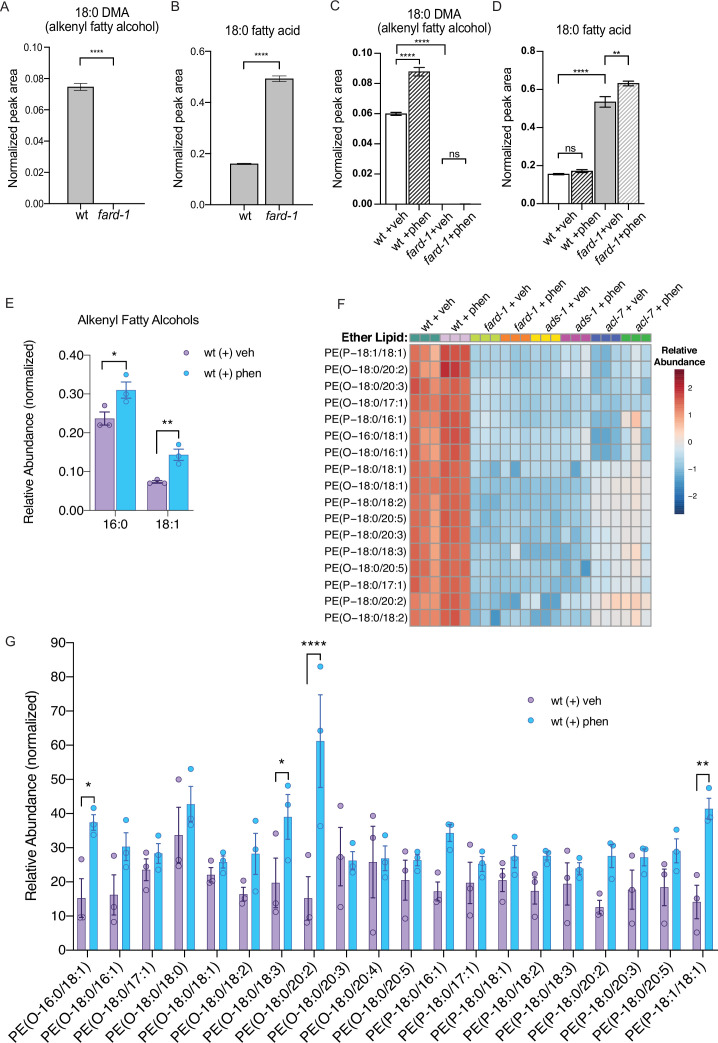
Figure 2—source data 1. Excel file containing raw, normalized, and normalized and log10 transformed mass spectrometry data for phosphatidylethanolamine containing ether lipids detected by liquid chromatography-tandem mass spectrometry (LC-MS/MS).
Data from three biological replicates are shown for molecules indicated for vehicle or 4.5 mM phenformin treatment, for four different genetic backgrounds: wild-type animals (N2, wt), BX10 (ads-1 mutant), BX259 (acl-7 mutant), and BX275 (fard-1 mutant). Compound identity for each detected lipid as well as raw, normalized, or transformed mass counts on each of three tabs. Note, several of the lipids were not uniformly detected or of low abundance, and thus were filtered by the MetaboAnalyst parameters used and not represented on the ‘Normalized’ and ‘Normalized-Log10 Transformed’ tabs.

Figure 2.

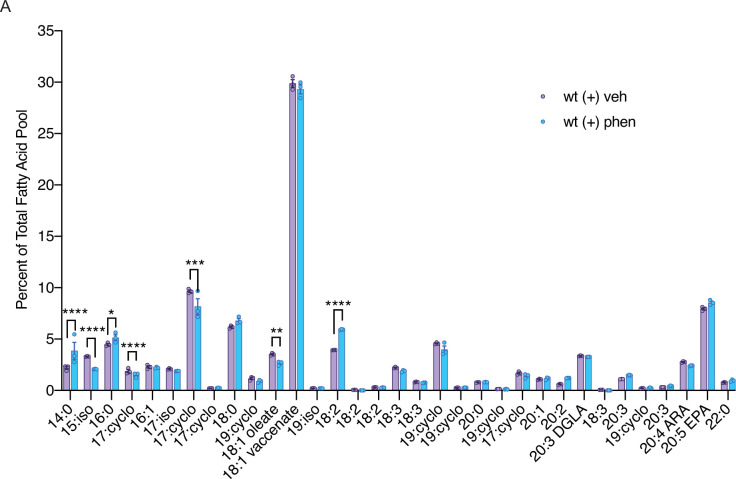
Figure 2—figure supplement 1. Biguanide treatment modulates abundance of fatty acids in C. elegans.

Figure 2—figure supplement 1.

A comparison of the percent of the total fatty acid pool for 33 fatty acids shows that 7 fatty acids are significantly altered in phenformin-treated wild-type worms. n=3 biological replicates. *, p<0.05; **, p<0.01; ***, p<0.001; ****, p<0.0001 by multiple t-tests (corrected for multiple hypothesis testing with two-stage step-up method of Benjamini, Krieger, and Yekutieli).
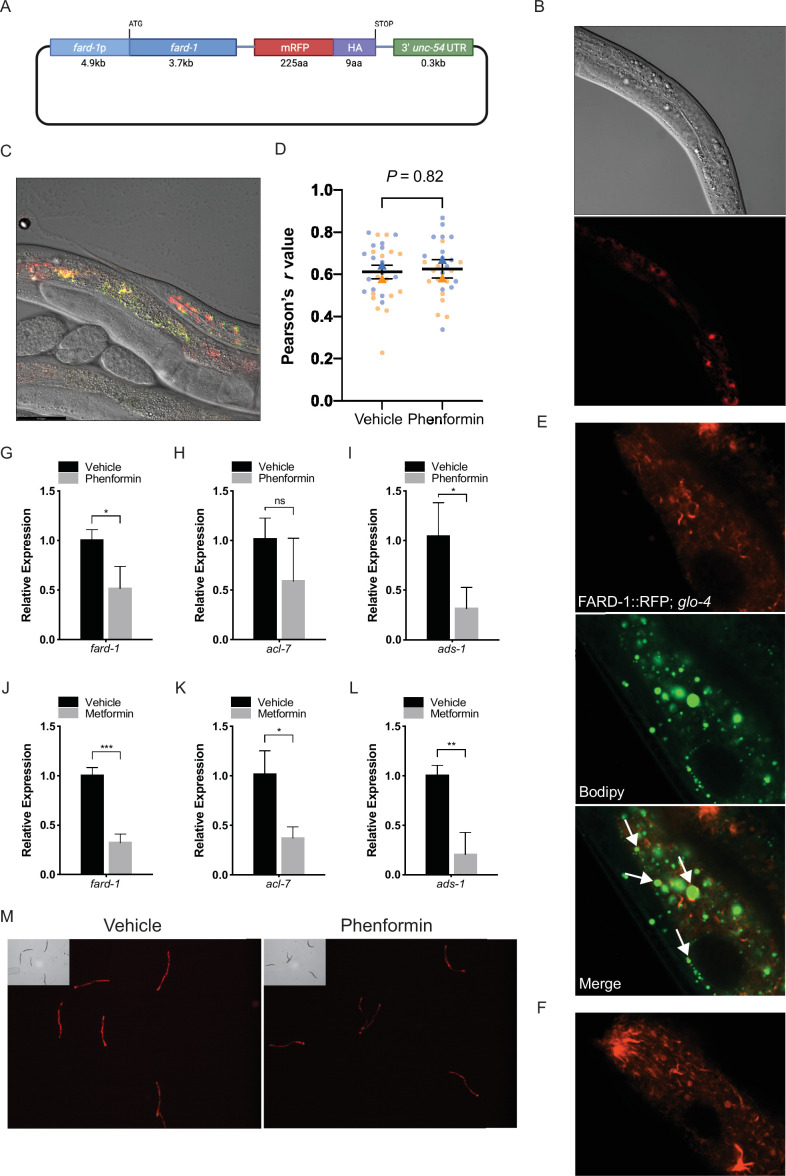
Figure 2—figure supplement 2. FARD-1::RFP localizes to intestinal lipid droplets and peroxisomes and is not positively regulated at the RNA or protein level by phenformin.

Figure 2—figure supplement 2.

(A) Schematic representation of the C. elegans FARD-1::RFP overexpression reporter. (B) FARD-1::RFP (fard-1 oe1) exhibits intestinal expression in C. elegans. FARD-1 displays a cytoplasmic distribution and an association with structures resembling lipid droplets (B, arrows). (C) Co-expression of FARD-1::RFP and peroxisomally targeted GFP::PTS1 in transgenic animals indicates partial colocalization of FARD-1 with peroxisomes in intestine. (D) Superplot displays colocalization of RFP and GFP in vehicle- or phenformin-treated GFP::PTS1; FARD-1::RFP transgenics (N=20 total worms assessed; 5 worms per condition; 3 images per worm [upper/mid/lower intestine]) for a total of 15 images (dots) per replicate; blue = replicate 1, orange = replicate 2. Correlation coefficients were separately calculated for each biological replicate and the mean is represented for each pool (blue or orange triangle). These two means were then used to calculate the average (horizontal bar), standard error of the mean (error bars), and p-value. Analysis of the average Pearson’s r values demonstrates no significant difference between colocalization of FARD-1::RFP and GFP::PTS1 in vehicle or phenformin-treated worms. n=2 biological replicates. (E) Confocal imaging of an integrated FARD-1::RFP reporter (fard-1 oe3) in C. elegans stained with C1-BODIPY-C12 (treated with glo-4 RNAi to remove BODIPY positive lysosome related organelles) demonstrates localization of FARD-1 protein to the surface of lipid droplets in the worm intestine. (F) In fard-1(oe3) transgenics, confocal imaging indicates FARD-1::RFP organization into web-like structures and bright punctae that represent the intersection of these ‘webs’. These structures may represent smooth endoplasmic reticulum. Images were taken using a Zeiss Plan-Apochromat 63×/1.4 Oil DIC M27 objective with a 2.0 scan zoom for each field. (G–I) Levels of fard-1, acl-7, and ads-1 mRNA decrease in wild-type C. elegans treated with 4.5 mM phenformin versus vehicle. n=3 biological replicates; ns, not significant; *, p<0.05 by unpaired t-test. (J–L) Levels of fard-1, acl-7, and ads-1 mRNA decrease in wild-type C. elegans treated with 50 mM metformin versus vehicle. n=3 biological replicates; *, p<0.05; **, p<0.01; ***, p<0.001 by unpaired t-test. (M) Phenformin (4.5 mM) results in decreased expression of the FARD-1::RFP translational reporter (fard-1 oe1). n=3 biological replicates; total assessed: N=30 worms per condition (10 worms per replicate).