. 2023 Aug 22;12:e82210. doi: 10.7554/eLife.82210

Figure 6. Phenformin modulates systemic lipid metabolism through an ether lipid-skn-1 signaling relay.

(A) The number of intestinal, C1-BODIPY-C12 labeled lipid droplets are significantly lower in day 1 adult phenformin-treated animals versus vehicle (FARD-1::RFP reporter transgenic [fard-1 oe3] worms are also treated with glo-4 RNA interference (RNAi) to remove BODIPY-positive lysosome-related organelles). n=2 biological replicates. *, p<0.05 by unpaired t-test. (B–C) Oil-red-O staining of day 3 adult phenformin-treated wild-type animals indicates that drug treatment leads to age-dependent somatic depletion of fat (Asdf), as previously reported for skn-1 gain-of-function mutants (skn-1 gf), suggesting that phenformin activates Asdf downstream of skn-1. Quantification (B) indicates that the proportion of Asdf animals is non-additively increased by phenformin treatment in an skn-1gf mutant, and that phenformin is no longer able to activate Asdf in three independent ether lipid deficient mutants (ads-1, acl-7, and fard-1). fard-1 overexpression results in an Asdf phenotype, moderately strengthened by phenformin treatment. For (B–C), n=3 biological replicates. (D–E) Oil-red-O staining of day 3 adult phenformin-treated wild-type and skn-1lf(zu135) animals reveals that the total loss of skn-1 function completely abrogates the phenformin-induced Asdf phenotype. Quantification (E) reveals that skn-1lf(zu135) decreases the proportion of Asdf animals relative to wild-type controls treated with phenformin. For (D–E), data represent n=3 biological replicates. (F) Phenformin treatment induces intestinal expression of dod-24, an established SKN-1 response target and innate immune effector, as indicated by increased dod-24p::GFP expression, in both OP50-1 and HT115 bacterial diets. RNAi knockdown of skn-1, fard-1, acl-7, and ads-1 all prevent significant phenformin-mediated induction of dod-24p::GFP. Quantification performed with at least 30 animals in each condition (10 animals assayed per replicate for 3 biologically independent experiments). ns, p>0.05; ****, p<0.0001 by two-way ANOVA followed by Tukey’s multiple comparisons test.

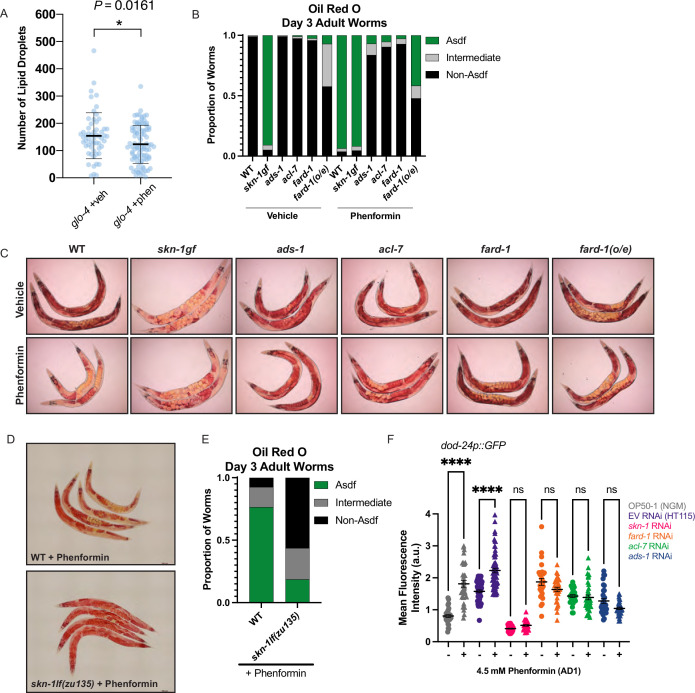
Figure 6.

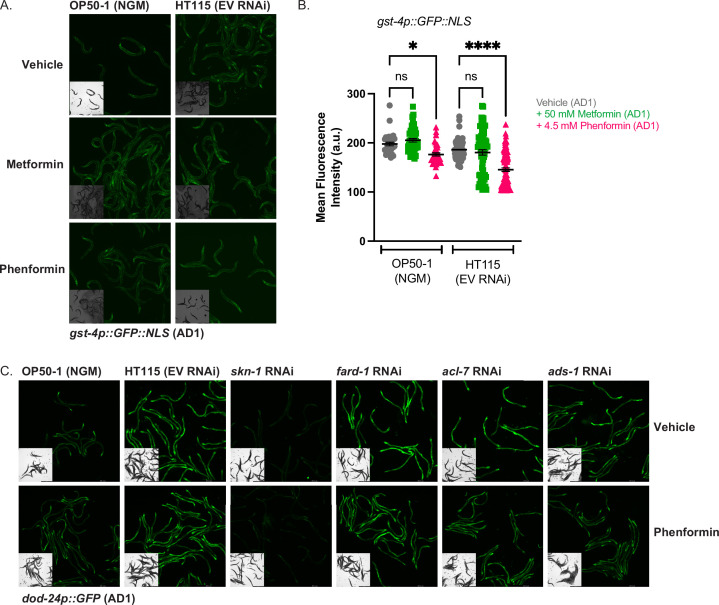
Figure 6—figure supplement 1. Biguanides do not activate gst-4 expression irrespective of bacterial diet.

Figure 6—figure supplement 1.

(A–B) GFP quantification of gst-4p::NLS::GFP animals treated from hatching with vehicle, 50 mM metformin, or 4.5 mM phenformin on either OP50-1 seeded nematode growth media (NGM) plates or EV HT115 seeded RNA interference (RNAi) plates, and imaged at adult day 1. For (B), data represent the mean ± SEM of at least 30 animals per condition (at least 10 animals per replicate combined from three biologically independent experiments). ns, p>0.05; *, p<0.05; ****, p<0.0001 by two-way ANOVA followed by Tukey’s multiple comparisons testing. (C) Representative images of dod-24p::GFP animals treated from hatching with vehicle or 4.5 mM phenformin and grown on OP50-1 seeded NGM plates, or RNAi plates seeded with EV, skn-1, fard-1, acl-7, or ads-1 RNAi and imaged at adult day 1, as quantified in Figure 6F.
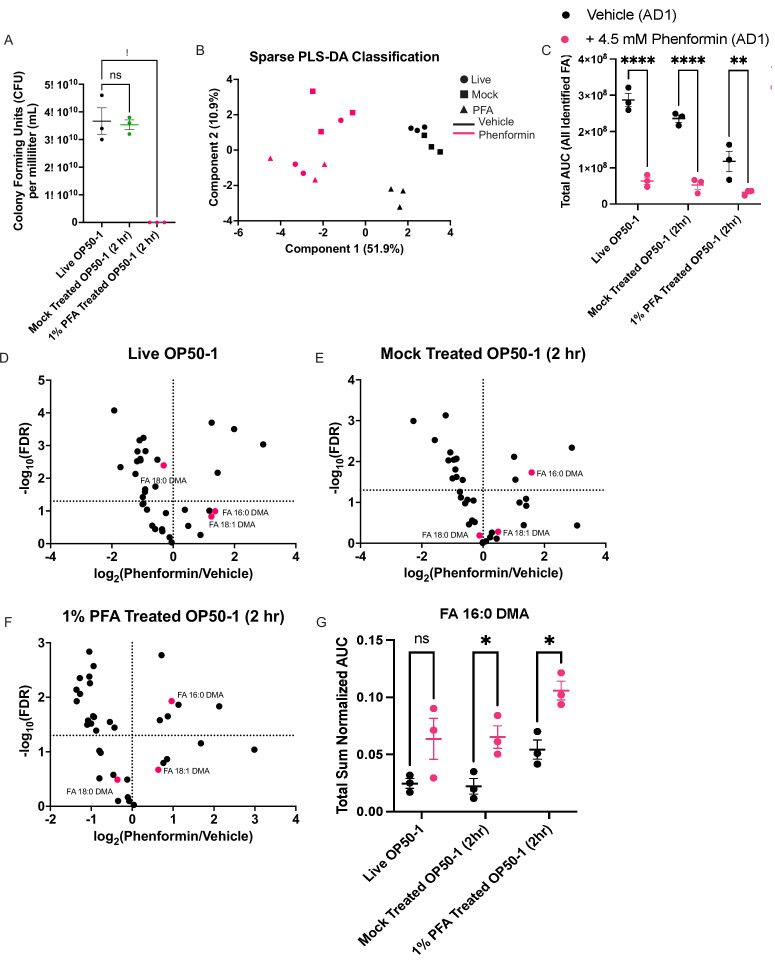
Figure 6—figure supplement 2. Disruption of bacterial growth and metabolism does not prevent biguanide-mediated induction of ether lipid synthesis.

Figure 6—figure supplement 2.

(A) Bacterial titer assay measuring viability of OP50-1 treated with standard seeding conditions (live OP50-1), treated with 1% phosphate buffered saline (PBS) for 2 hr (mock-treated OP50-1 [2 hr]), or treated with 1% paraformaldehyde (PFA) for 2 hr (1% PFA-treated OP50-1 [2 hr]). Data represent mean ± SEM, n=3 biological replicates. ns, p>0.05; *, p<0.05 by one-way ANOVA followed by Dunnett’s multiple comparisons test. (B) Sparse partial-least squares linear discriminant analysis (PLS-DA) of total sum normalized AUC for lipids measured using extraction and derivatization of total fatty acids as fatty acid methyl esters analyzed by gas chromatography/mass spectrometry (GC/MS) in wild-type animals treated with vehicle/4.5 mM phenformin until adult day 1, and grown either on live OP50-1, mock-treated OP50-1 (2 hr), or 1% PFA-treated OP50-1 (2 hr). Samples separate predominantly on Component 1 by drug treatment. n=3 biological replicates. (C) Combined total area values for all derivatized fatty acids identified in samples collected in (B) reveal that biguanides reduce total fatty acid abundance irrespective of bacterial growth conditions. The same number of worms of the same stage were used as input for each biological replicate. Data represent mean ± SEM, n=3 biological replicates for each condition. **, p<0.01; ****, p<0.0001 by two-way ANOVA followed by Tukey’s multiple comparisons testing. (D–F) Volcano plots for all differentially expressed lipids reveal that ether lipids are preferentially sustained despite a global loss of somatic lipids observed, irrespective of bacterial growth conditions. Fold change and false discovery rate (FDR) calculations were performed with t-tests followed by Benjamini-Hochberg FDR adjustment using MetaboAnalyst 3.0. (G) Total sum normalized AUC measurement of 16:0 dimethylacetal (DMA) levels across bacterial growth conditions and drug treatments reveal that biguanides increase 16:0 DMA levels irrespective of the bacterial growth and metabolic conditions. Data represent mean ± SEM. ns, p>0.05, *; p<0.05 by two-way ANOVA followed by Tukey’s multiple comparisons testing.
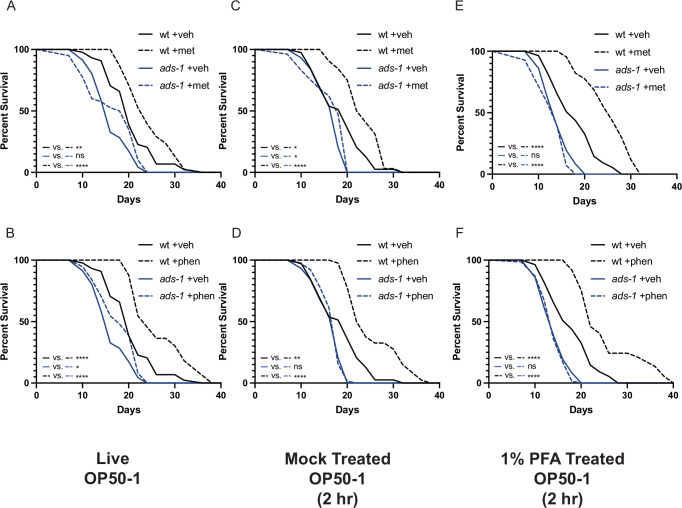
Figure 6—figure supplement 3. Inactivation of ether lipid machinery disrupts biguanide-mediated lifespan extension independent of effects on bacterial growth or metabolism.

Figure 6—figure supplement 3.

Lifespan analyses of wild-type (wt) or ads-1 mutant animals grown on live OP50-1 (A–B), mock-treated OP50-1 for 2 hr (C–D), or 1% paraformaldehyde (PFA)-treated OP50-1 for 2 hr (E–F) reveal that ads-1-mediated ether lipid deficiency disrupts metformin (top row) or phenformin (bottom row) mediated lifespan extension independent of whether the bacterial food source is live or killed and metabolically inactive (1% PFA-treated). Results are representative of two biological replicates. *, p<0.05; **, p<0.01; ***, p<0.001; ****, p<0.0001 by log-rank analysis. Note that the results from panels (A–B), (C–D), and (E–F) share the same same-day wild-type controls as they originate from the same replicate. Please refer to Supplementary file 1 for tabular survival data and biological replicate summary statistics.