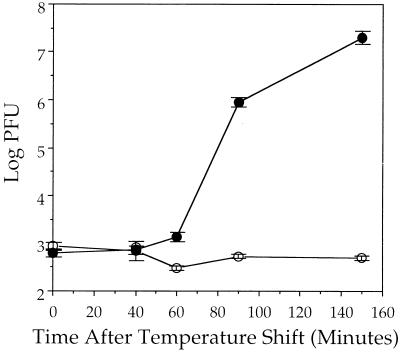
FIG. 2.
Effect of ATP depletion on production of infectious virus. Vero cells were infected with tsProt.A and processed as shown in Fig. 1. Cells were recovered at particular times after shifting to the permissive temperature (indicated on the horizontal axis), and extracts were prepared. Levels of PFU present in each extract are represented on the logarithmic vertical axis. Plotted points represent the mean and standard deviation from the mean for triplicate plaque assays. Viral yields at zero time after the temperature shift derive from residual input virus (9). ●, control-treated cells; ○, ATP-depleted cells.

