
FIGURE 3.
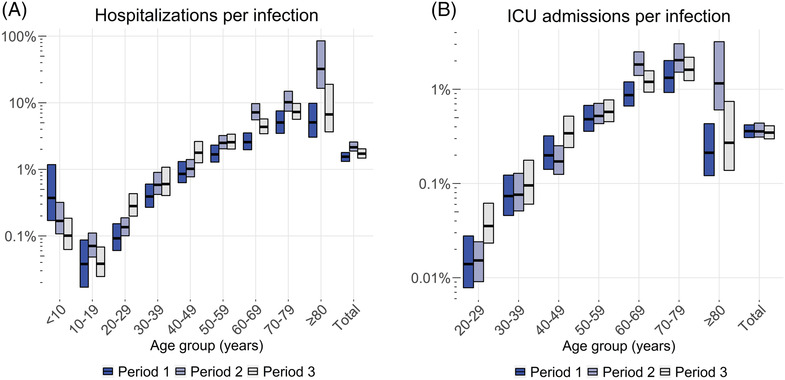
Estimated age‐specific and overall infection hospitalization rates (A) and infection ICU admission rates (B) in the Netherlands per epidemic period. Horizontal lines represent the point estimates and bars the 95% ranges using 1000 simulations. Period 1 approximately covers infections from late‐February 2020 to mid‐June 2020, period 2 from mid‐June 2020 to mid‐February 2021, and period 3 from mid‐February 2021 to late‐June 2021. Note that the y‐axes use a log‐scale. Absolute estimates are available in the Tables S1–S3. ICU, intensive care unit.