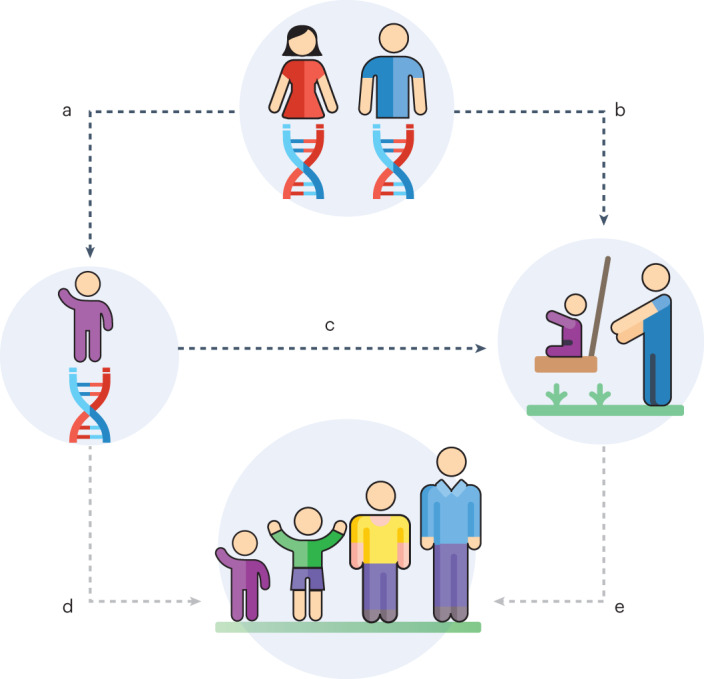
Fig. 1. A model of the associations tested or assumed in the present study.

The paths tested (dark dotted lines) or assumed (light dotted lines) in the present study. Path b is the path focused on in this study; it depicts the possibility that parents’ genes are associated with the parenting they provide to their children. To test this possibility, it is necessary to control for path a, which depicts genetic transmission from (biological) parent to child, and path c, which depicts the possibility that children’s genes are also associated with the parenting they receive (this is often referred to as evocative gene–environment correlation or child effects). If paths a and c are not controlled for, associations between parental genes and parenting may reflect genetic transmission and evocative gene–environment correlations (paths a*c). We therefore controlled for children’s polygenic score in the models. Note that this study did not test offspring developmental outcomes (such as attainment or health outcomes), which are represented at the bottom of the figure and which are connected to the top of the figure by paths d and e. It is assumed, on the basis of previous literature (Supplementary Table 1), that the genes parents pass on and the parenting they provide both affect offspring outcomes (in the figure, this is illustrated by paths a*d for genes, and paths b*e for parenting). Also note that even though the parent icon shows both mothers and fathers; most of the analyses used maternal polygenic score due to data availability; fathers’ polygenic scores were analysed in only a subset of models.
