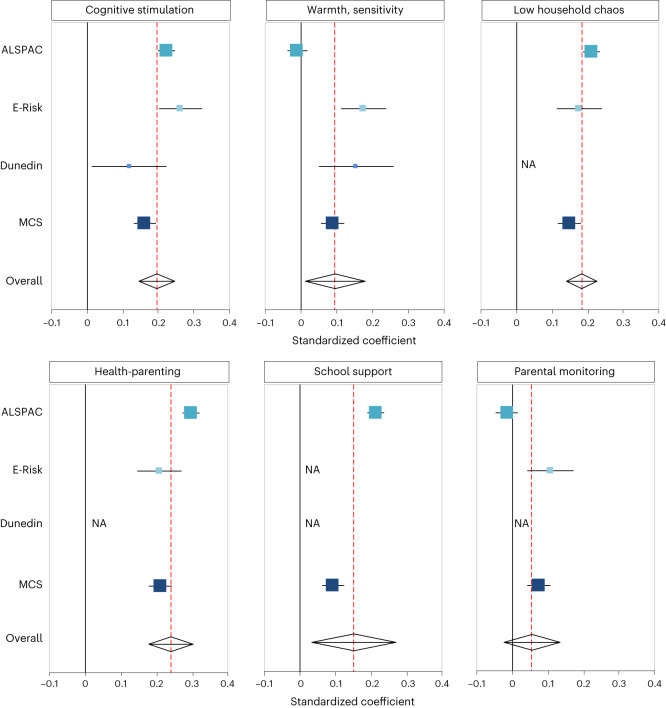
Fig. 3. Associations between maternal polygenic scores and parenting during childhood and adolescence.
Associations (expressed as standardized regression coefficients) between maternal education polygenic scores and measures of parenting during childhood (cognitive stimulation; warmth, sensitivity; low household chaos; health-parenting; school support) and adolescence (parental monitoring) in the ALSPAC, E-Risk, Dunedin and MCS cohorts. Not all measures were available in each cohort (for example, measures of school support were only available in the ALSPAC and MCS cohorts). The overall effect was calculated using a random-effects model. The centre of the effect marker indicates the estimate of the association between polygenic score and parenting, expressed as a standardized regression coefficient. The error bars indicate 95% confidence intervals. The size of the effect size markers corresponds to the sample size, so that larger sample sizes have larger markers. The number of participants (mothers) included in the analysis were as follows: for cognitive simulation ALSPAC n = 6,180; E-Risk n = 879; Dunedin n = 333; MCS n = 5,238; for warmth, sensitivity ALSPAC n = 5,226; E-Risk n = 880; Dunedin n = 330; MCS n = 5,382; for low household chaos ALSPAC n = 6,210; E-Risk n = 878; MCS n = 5,268; for health-parenting ALSPAC n = 5,649; E-Risk n = 877; MCS n = 5,268; for school support ALSPAC n = 6,603; MCS n = 5,385; for parental monitoring ALSPAC n = 4,092; E-Risk n = 866; MCS n = 5,580. NA, not applicable.

