
Fig. 2. Data mining pipeline to find correlations between gut microbiome, antibiotic resistance in E. coli, temperature and humidity.
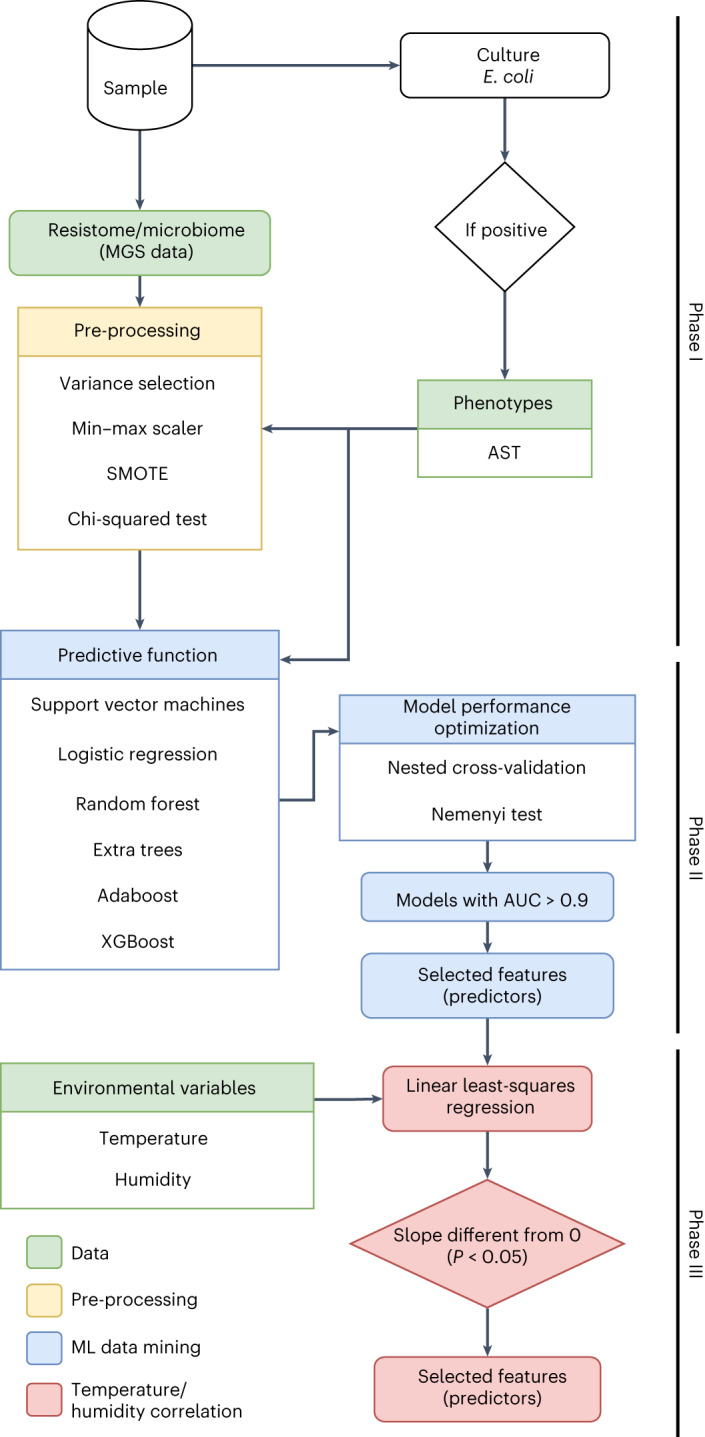
The full data analysis workflow of the bespoke data mining method based on ML. Input data are shown in green. Phase I involves metagenome data pre-processing (in yellow). The steps are described in detail in the Methods section. Phase II involves the training and testing of ML-powered predictive functions to isolate metagenomic features (that is, the ARG count and relative abundances of microbial species present in the sample) correlated with phenotypic resistance (in blue). Phase III involves fitting regression models (discussed in the next section) to isolate metagenomic features that better correlate with variations of temperature and humidity (in red). AUC, area under the curve.