Fig. 1.
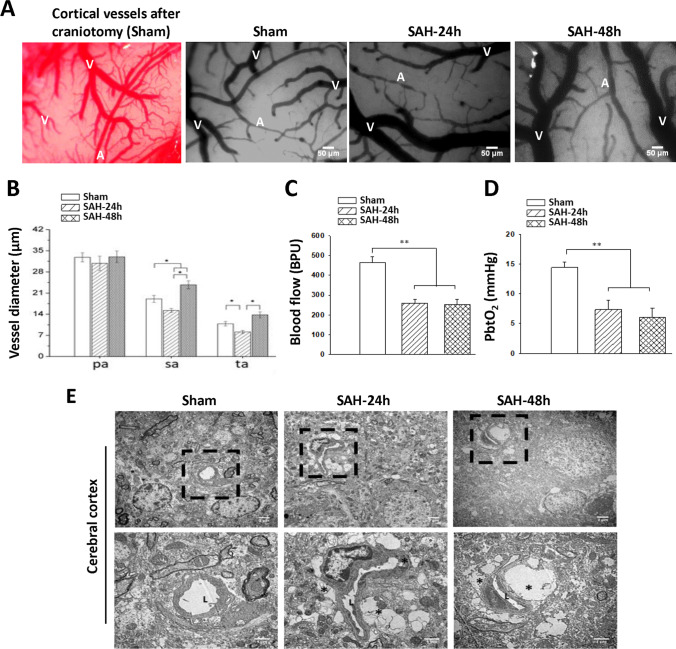
Astrocyte swelling and impaired microcirculation on the cortical surface at 24 h and 48 h after SAH induction. A After a craniotomy was performed from the sham, SAH 24 h and SAH 48 h groups, all vasculatures including the main arterioles and venules on the brain surface were clearly seen (A represents arterioles, V represents venules, bar = 50 μm). B Observation of the arteriole diameters of primary (pa), secondary (sa), and terminal (ta) arterioles using a CAM1 capillary anemometer. Quantitatively, the diameters of the sa and ta were smaller at 24 h in the SAH group than in the sham group and were increased at 48 h as compared with 24 h after SAH. C The regional cerebral blood flow and D PbtO2 were significantly lower at both 24 h and 48 h in the SAH group than in the sham group. E The arrow indicates microvessels in representative electron micrographs (bar = 2 μm). The areas marked by a square are shown in higher magnification of the lower panel (bar = 1 μm). L marks the lumen of a microvessel and asterisks mark the end-feet of astrocytes. The swollen end-feet (*) remarkably compressed the microvessels in the SAH 24 h and SAH 48 h groups. Data are expressed as means ± SEM. *P < 0.05, **P < 0.01, n = 4

