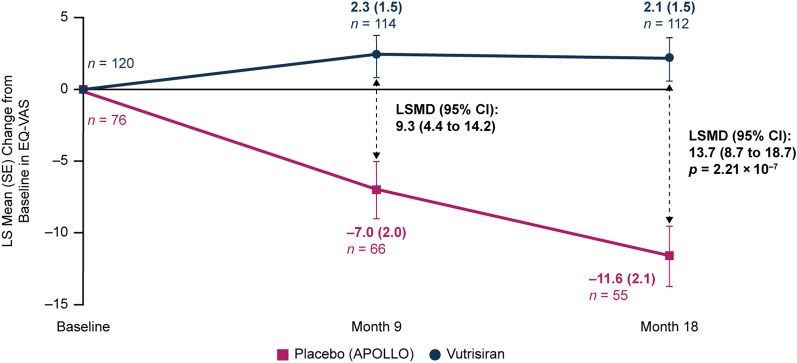
Fig. 4.
LS mean change in EQ-VAS score (range 1–100) from baseline to month 18 in patients receiving vutrisiran or placebo (APOLLO). At baseline, the mean (± SD) EQ-VAS was 64.5 (18.5) in the vutrisiran group and 54.6 (18.0) in the external placebo group. mITT population. Value of n is the number of evaluable patients at each timepoint. Data plotted are MMRM data. EQ-VAS records a respondent’s self-rated health at the time of assessment (range 0–100), with minimum and maximum values ranging from “the worst health you can imagine” (0) to “the best health you can imagine” (100). CI confidence interval, EQ-VAS EuroQoL-Visual Analog Scale, LS least squares, LSMD LS mean difference, mITT modified intent-to-treat, MMRM mixed-effects model for repeated measures, SD standard deviation, SE standard error

