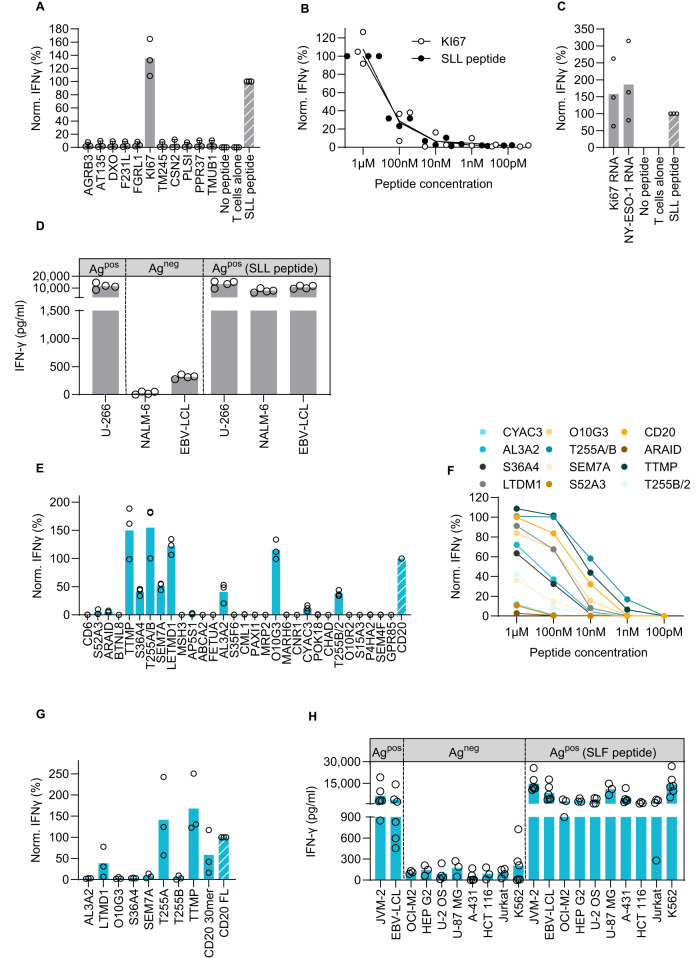
Fig. 3. Mapping the off-target reactivity profile of 1G4 and A23 TCRs does not reveal clinically relevant cross-reactivities.
1G4 TCR-Ts were incubated with HLA-A2+ B-LCL cells that were either loaded with 9-mer peptides containing multiple amino acid exchanges compared to the original SLL peptide at a 10−7 M concentration (A), or at indicated concentrations (B), or electroporated with mRNA encoding 30-mer peptide sequences coupled to a GFP tag, containing potentially cross-recognized 9-mer peptides in the middle (C). Supernatants of 24 h co-cultures were analyzed for IFN-γ content by ELISA. The graphs show pooled data for three (A–C) or four (D) independent experiments with three technical replicates in each. Dots represent means of technical replicates. Values are normalized to the IFN-γ production induced by the original target peptide (range 2690–11,600 pg/ml). D HLA-A2+ cell lines expressing the intended target NY-ESO-1 (U-266), denoted Agpos, or the potentially cross-reactive protein Ki67 (NALM-6, EBV-LCL) but not expressing NY-ESO-1 (Agneg), were loaded or not with the NY-ESO-1 SLL peptide (100 nM). Cell lines were co-incubated with 1G4 TCR-Ts. After 24 h, T-cell activation was assessed by measuring the IFN-γ production by ELISA. The graph shows pooled data from 3 to 4 independent experiments each run with three technical replicates. Dots represent means of technical replicates. A23 TCR-Ts were incubated with HLA-A2+ K562 cells that were either loaded with 9-mer peptides containing multiple amino acid exchanges compared to the original SLF peptide at a 10−7 M concentration (E), or at indicated concentrations (F), or electroporated with mRNA encoding 30-mer peptide sequences coupled to a GFP tag, containing potentially cross-recognized 9-mer peptides in the middle (G). Supernatants of 24 h co-cultures were analyzed for IFN-γ content by ELISA. The graphs show pooled data for three independent experiments with three technical replicates in each. Dots represent means of technical replicates, except for (F), in which each dot denotes the mean of three independent experiments with three technical replicates in each. Values are normalized to the IFN-γ production induced by the original target peptide (range 5100–22,000 pg/ml). H HLA-A2+ cell lines expressing the intended target CD20 (JVM-2, EBV-LCL), denoted Agpos, or the potentially cross-reactive proteins LETMD1 (OCI-M2, Hep-G2), TTMP (U-2 OS, U87-MG) or T255A (A-431, HCT-116) but not CD20, were loaded or not with the CD20 peptide SLF (100 nM). Cell lines were co-incubated with A23 TCR-Ts. After 24 h, T-cell activation was assessed by measuring the IFN-γ production by ELISA. The graph shows pooled data from 3 to 6 independent experiments with three technical replicates in each. Dots represent means of technical replicates.

