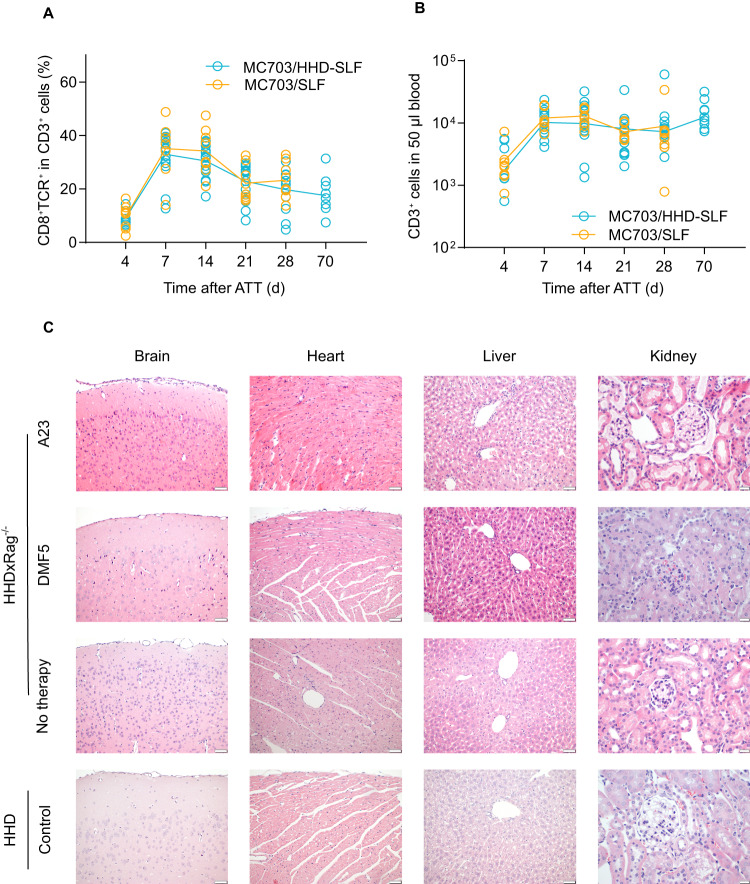
Fig. 6. A23 TCR-Ts persist in treated animals and show no off-target reactivity in vivo to antigens presented on HHD.
Peripheral blood samples from mice receiving T-cell therapy with A23 TCR-Ts were analyzed by flow cytometry. Graphs depict percentage of CD8+TCR+ HHD T cells within the CD3+ population (A) or total number of CD3+ HHD T cells (B) at indicated time points after ATT (adoptive T cell transfer) in mice bearing MC703-SLF (yellow) or MC703/HHD-SLF tumors (blue). C Indicated organs of HHDxRag1−/− mice were resected 10 weeks after transfer of A23 TCR-Ts when tumors were rejected. Serial sections of organs were stained with hematoxylin and eosin. Representative pictures are shown. Organs from tumor-bearing HHDxRag1−/− mice that were left untreated (5–7 weeks after tumor cell injection) or were treated with DMF5 T cells (4 weeks after therapy start) are shown as controls. Organs taken from untreated immunocompetent HHD mice are shown for comparison. Length of scale bar denotes 50 µm in brain, heart and liver sections and 20 µm in kidney sections.

