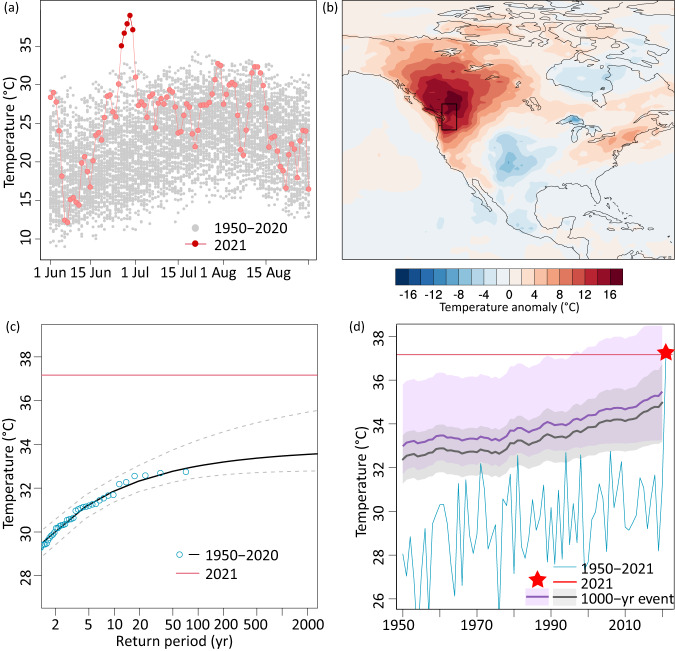
Fig. 1. Characteristics of the 2021 Pacific Northwest (PNW) heatwaves.
a Daily maximum temperatures averaged over the PNW (45°N-52°N and 119°W-123°W, highlighted as black box in (b)). Gray shows 1950–2020 and light red 2021 based on ERA5 reanalysis. The 5 hottest days analyzed in this study are highlighted in dark red. b Daily maximum temperature anomaly during the hottest 5-day period (highlighted in (a)) during the 2021 heatwave relative to the 1981–2010 average. c Stationary GEV fit to annual 5-day maximum temperatures (Tx5day) over 1950–2020 (see Methods), with best estimate statistical upper bound of 33.6 °C) and as red line the 2021 heatwave. d Time series of (blue line) annual 5-day maximum temperatures and as red line the 2021 heatwave anomaly. (Dark gray and violet line) return levels based on non-stationary GEV fit (Maximum Likelihood Estimate and Bayesian estimate, respectively) to 1950–2020 using smoothed global mean temperature as covariate for location and scale parameters (see Methods, corresponding figures for 1-day maxima are shown in Fig. S1).

