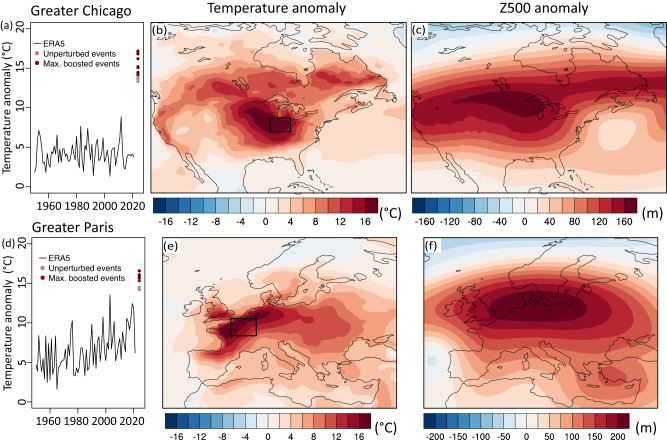
Fig. 5. Heatwave storylines for Greater Chicago and Paris region.
a, d 5-day running average of daily maximum temperature (Tx5day) anomalies of average temperature over (a) Greater Chicago (84–90°W, 38–42°N) and (d) Greater Paris (1–7°E, 47–51°N) for (black line) the period 1950–2021 in ERA5, (light red) three unperturbed events and (dark red) five maximum boosted members for each event. b, e Tx5day anomaly patterns and (c, f) 500hPa geopotential height anomaly during the hottest 5-day period in the maximum boosted model member shown in (a) and (d), respectively (see other events in Fig. S10).

