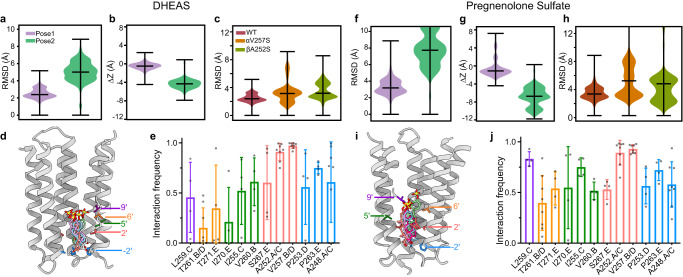
Fig. 5. Stability and interactions of sulfated neurosteroids in the pore.
a DHEAS stability based on rmsd in simulations initiated with the sulfate oriented up (purple) or down (green). b DHEAS movement along the channel pore (z-axis) during simulations. Positive and negative numbers indicate movement toward the outer and inner membrane leaflets, respectively. c DHEAS stability in simulations of WT, αV257S, and βA252S systems in the sulfate-up pose. Both mutations were associated with increased deviations relative to the starting pose. Violin plots (a–c) represent probability densities from 4 independent simulation replicates of >400 ns each, sampled every 0.4 ns (n > 4000), with markers indicating median and extrema. d, Representative DHEAS poses during simulations. Five poses were chosen by cluster analysis based on neurosteroid rmsd. Representative -2’, 2’, 5’, 6’, and 9’ residues along the righthand M2 helix are labeled and colored for reference to the bar graph in (e). e Interaction frequencies of residues in contact with DHEAS. Residues are grouped and colored according to panel (d). Each column indicates mean ± standard deviation of 4 independent simulation replicates (n = 4), with values from individual replicates as gray dots. f–j Analyses for PS as in panels (a–e).

