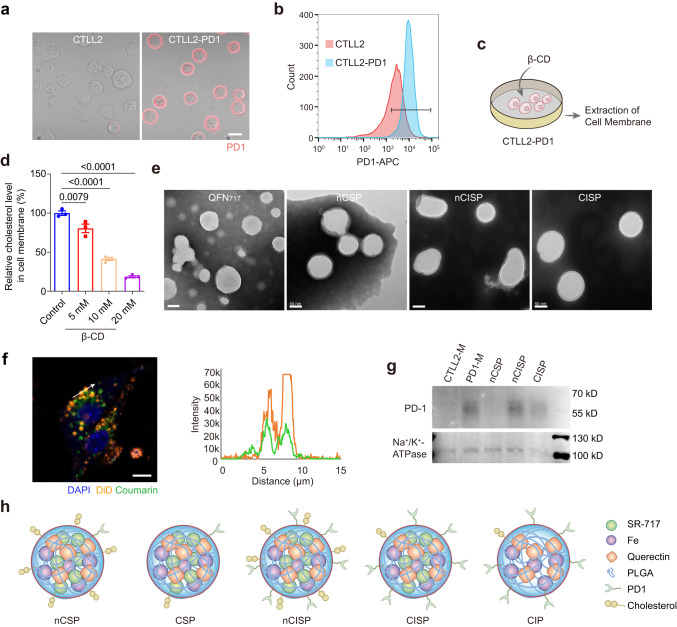
Fig. 1. Preparation and characterization of CISP.
a Representative fluorescence images of PD-1-APC on cell membrane (n = 5 technical replicates). Scale bar = 10 μm. b The expression of PD-1 on cell membrane detected by flow cytometry (n = 3 technical replicates). c Schematic illustration showing the process to prepare low-cholesterol membrane. d Relative level of cholesterol in cell membrane after cells incubated with different concentration of (2-hydroxypropyl)-β-cyclodextrin (β-CD) for 0.5 h (n = 3 independent samples). e Representative TEM images of QFN717, nCSP, nCISP and CISP (n = 3 independent samples). Scale bar = 50 nm. f The localization of cell membrane (marked with DiD) and QFN717 core (marked with coumarin) in CISP, and the fluorescence intensity of DiD and coumarin on the arrow line. B16F10 cells were incubated with CISP for 4 h (n = 3 independent samples). Scale bar = 5 μm. g Western blot analysis of PD-1 and Na+/K+-ATPase in membrane of CTLL2 (CTLL2-M), membrane of CTLL2-PD1 (PD1-M), nCSP, nCISP and CISP. h Schematic illustration showing nCSP, CSP, nCISP, CISP and CIP used in this study. Data represent mean ± SEM (d). Statistical significance was determined by one-way ANOVA test in d, and it was two-sided and adjustments were made for multiple comparisons. The experiments for a, b, d–f, g were repeated three times independently with similar results. Source data are provided as a Source Data file. MFI mean fluorescence intensity, QFN Quercetin-ferrum nanoparticles, QFN717 QFN loaded with SR-717, nCSP normal-Cholesterol cell membrane-coated QFN717, CSP low-cholesterol membrane-coated QFN717, nCISP normal-Cholesterol cell membrane-coated ICB agent and QFN717, CISP low-cholesterol membrane-coated ICB agent and QFN717, CIP low-cholesterol membrane-coated ICB agent and QFN.

