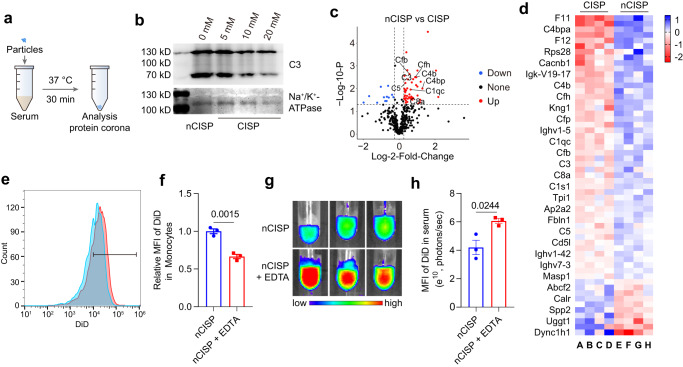
Fig. 5. CISP absorbed less complement C3 in serum.
a Schematic illustration showing the process to detect protein corona absorbed on CISP. b Western blot analysis of C3 absorbed on nCISP and CISP. c Volcano plot showing the serum proteins absorbed on CISP and nCISP. Fold_change means nCISP/CISP (n = 4 independent samples). d Heat map showing the serum proteins absorbed on CISP and nCISP with significant difference (fold change >1.2, p < 0.05) (n = 4 independent samples). e, f Uptake of nCISP by monocytes detect by flow cytometry (e) and the relative mean fluorescence intensity (MFI) of DiD in monocytes (f) (n = 3 independent samples). Blood of mice was collected and incubated with EDTA (2 mM) for 20 min, and nCISP was added into blood and incubated for 30 min. g, h Fluorescence images of plasma (g) and the mean fluorescence intensity (MFI) of DiD in plasma (h) (n = 3 independent samples). Data represent mean ± SEM (f, h). Student’s two-sided t test was used for the statistical analysis in f, h. The experiments for b, e–h were repeated three times independently with similar results. Source data are provided as a Source Data file. C3 complement 3, QFN Quercetin-ferrum nanoparticles, QFN717 QFN loaded with SR-717, nCISP normal-Cholesterol cell membrane-coated ICB agent and QFN717, CISP low-cholesterol membrane-coated ICB agent and QFN717.

