Figure 1.
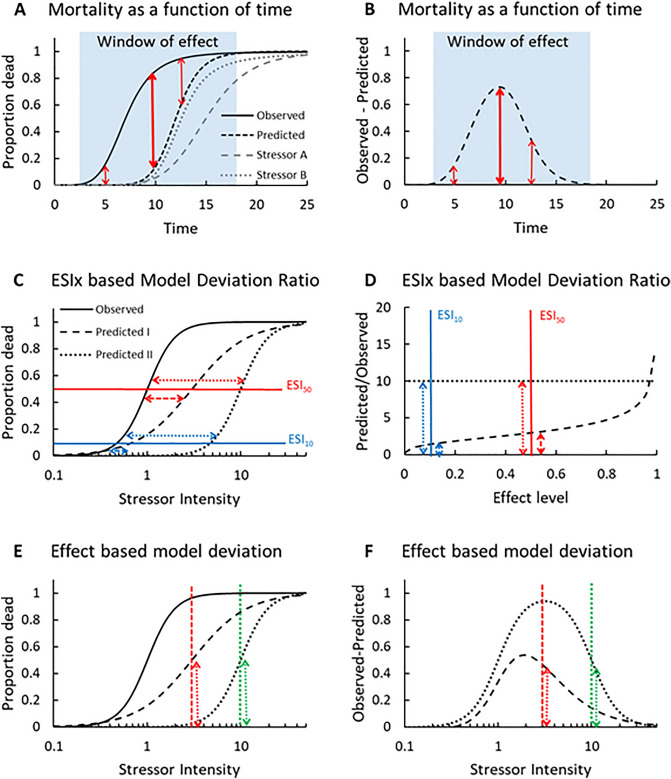
The mortality as a function of time of two individual stressors, their combination and the prediction using the Multiplicative model (A), and the difference between observed and predicted mortality as a function of time (B). Vertical arrows show the difference between the observed and predicted mortality at selected time points (thick arrow is the time-point of maximal difference). The blue area shows the time interval with differences between observed and predicted effects. Quantifying interactions using Concentration Addition as a null model and the ratio between predicted and observed effects (the model deviation ratio) at specific stressor intensities (ESIx) (C,D). (C) Observed mortality as a function of cumulated stressor intensity of a stressor combination together with two hypothetical predictions: one where the predicted curve is parallel to the observed curve (dotted curve) and one where the predicted curve has a lower slope than the observed curve (broken curve). Blue and red horizontal lines indicate the difference between observed and predicted curves at the two effect levels ESI10 and ESI50. The ratio between predicted and observed effects as a function of effect level (D), showing that the ratio between the two parallel curves is independent of effect level (dotted line), whereas it varies for non-parallel curves (broken line). For non-parallel curves, the median model deviation ratio is at ESI50. The two effect levels ESI10 and ESI50 from (C) are given in blue and red vertical lines, respectively, in (D). Quantifying interactions using Multiplicative as a null model at different stressor intensities (E,F). (E) Equivalent to (C), but when using IA as a null model the difference between observed and predicted curves are measured as the difference in mortality illustrated by the vertical red and green line crossing the ESI50 of the two predictions. (F) The difference between observed and predicted mortality (varying between 0 and 1) as a function of stressor intensity and illustrates that the difference between observed and predicted mortality is extremely dependent on the chosen stressor intensity.

