Fig. 3.
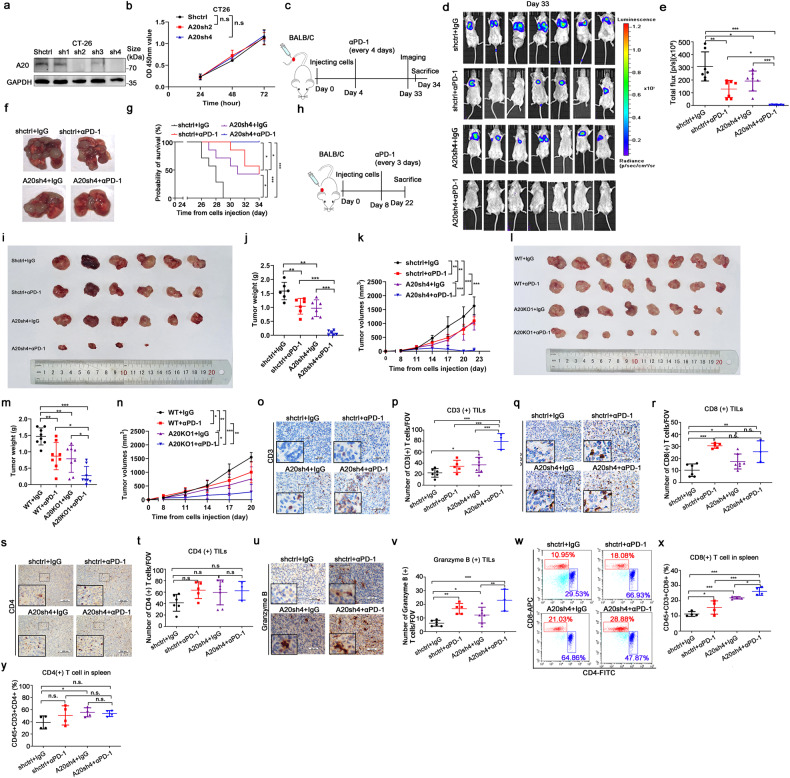
A20 inhibited antitumor immune response in vivo. a The expression of A20 in mice CT26-luc-GFP cells. b The cell proliferation of CT26-luc-GFP cells detected by CCK8 kit, n = 4. c The experimental scheme of the animal study. d The in vivo images of mice tumors with different treatments were detected by the IVIS bioluminescence imaging system, n = 7. e Statistical analysis of total flux from the IVIS bioluminescence images. f The representative images of the metastatic nodes in lung from BALB/C mice. g The survival curve of mice, n = 7. h The experimental scheme of the animal study. i The images of tumors excised from BALB/C mice at the end of experiments, n = 6. j Tumor weights of the four treatment groups, n = 6. k Tumor growth curves of the four treatment groups, n = 6. l The images of tumors excised from BALB/C mice at the end of experiments, n = 8. m Tumor weights of the four treatment groups, n = 8. n Tumor growth curves of the four treatment groups, n = 8. o–v The infiltration of CD3 (+) (X400), CD8 (+) (X400), CD4 (+) (X200), and Granzyme B(+) (X400) T cells detected by immunohistochemical staining. p-value was calculated by one-way ANOVA analysis. Shctrl+IgG, n = 7, Shctrl+αPD-1, n = 5, A20sh4+IgG, n = 7, A20sh4+αPD-1, n = 3. w–y Flow cytometry analysis of CD8 (+) and CD4 ( + ) T cells of mice spleens (n = 4 per group). Data was represented as the mean ± SD. *p < 0.05; **p < 0.01; ***p < 0.001; n.s. not significant

