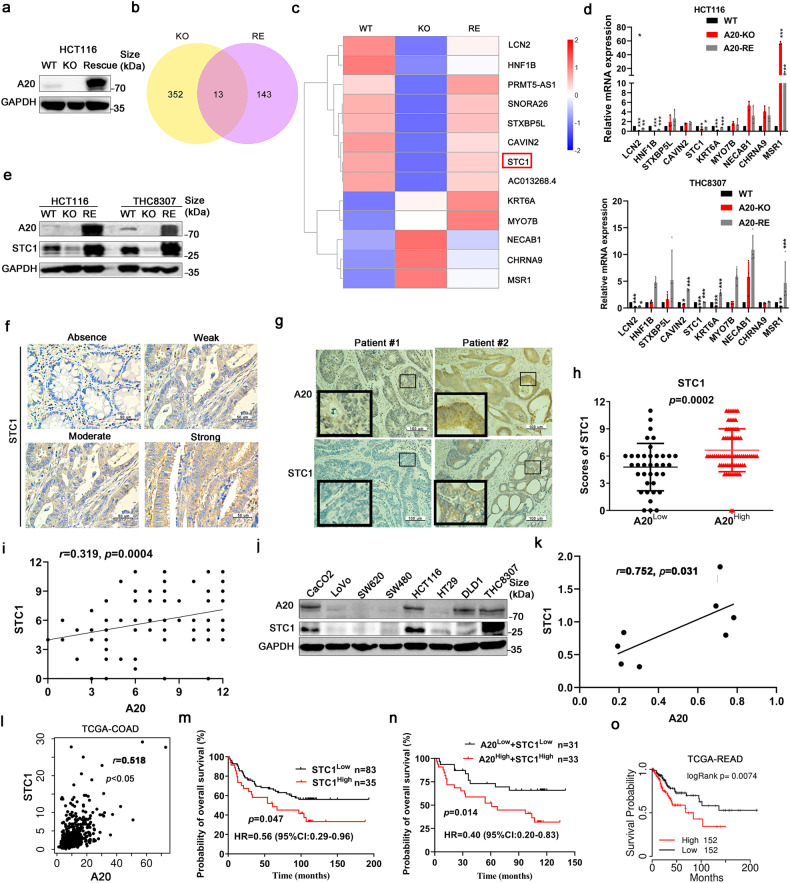
Fig. 5.
A20 regulated STC1 expression. a A20 expression level in A20-knockout (KO) and A20-KO-rescue (RE) cells. RNA-sequencing was conducted to investigate the gene profiles from HCT116 cells after manipulation of A20 expression (WT: wild type; KO: A20-knockout; RE: A20-rescue). b The Venn diagram of the genes altered by A20 with the p-value < 0.05. c Heat map of 13 genes (n = 3 samples of each group). Blue, downregulation; red, upregulation. d The expression of 10 genes were detected by q-PCR, n = 4. e The expression of STC detected by immunoblotting. f Representative immunohistochemical staining images of different intensity of STC1 expression in tumor specimens. g Representative images of STC1 and A20 staining in tumor specimens from CRC patients. h Statistical analysis of STC1 expression in CRC tissues with high or low A20 expression, n = 118. i Correlation analysis of STC1 and A20 expression in CRC tissues, n = 118. j Immunoblotting analysis of A20 and STC1 expression in CRC cell lines (n = 8). k, l Correlation analysis of A20 and STC1 expression in CRC cell lines and TCGA database. m, n Survival analysis of CRC patients (H-score≤6, low; >6, high). o Survival analysis of CRC patients in TCGA dataset

