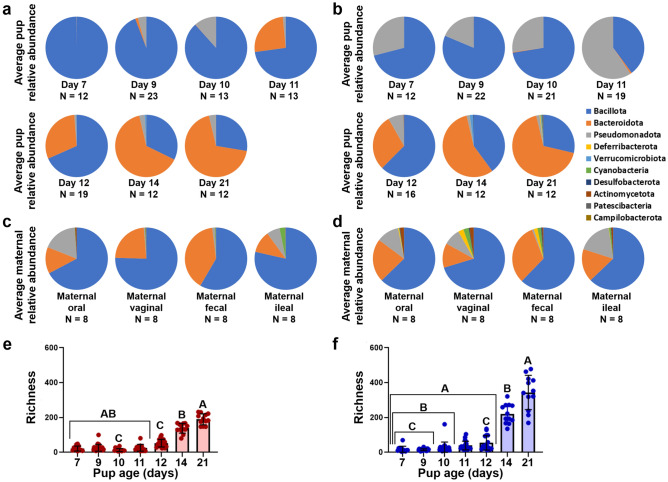
Figure 1.
Fecal Bacteroidota relative abundance and alpha diversity are greater in older pups. (a–d) Circle graphs depicting average relative abundance of samples. Figure key located on right side of panel. (a,b) Pup fecal samples grouped by timepoint from (a) GM1 and (b) GM4 mice. (c,d) Maternal tissue samples groups by sample tissue type for (c) GM1 and (d) GM4 mice. (e,f) Bar charts depicting richness of samples with bars representing group averages and error bars representing standard error of mean (SEM). Each symbol represents an individual sample. (e) Average GM1 pup fecal alpha diversity grouped by timepoint. (f) Average GM4 pup fecal alpha diversity grouped by timepoint. Statistics were calculated using ANOVA on ranks within each GM, like letters within a graph denote a significant difference in pair wise comparisons using Dun’s post hoc.

