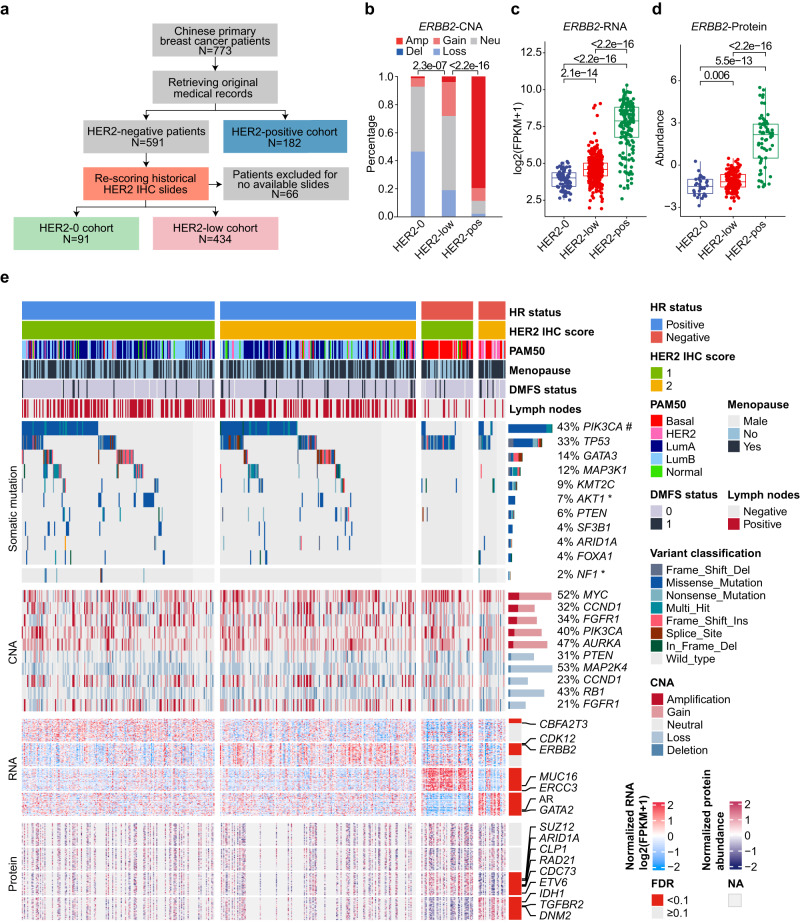
Fig. 1. The design and molecular landscape of the Fudan University Shanghai Cancer Center (FUSCC) HER2-low breast cancer cohort.
a Flowchart of the patient selection process and stratification. b Bar plot comparing the copy number alterations (CNAs) of ERBB2 among HER2 status subgroups based on Genomic Identification of Significant Targets in Cancer (GISTIC) analysis. Amp: 2, gain: 1, neu: 0, loss: −1, del: −2. P values were computed using the two-sided Fisher’s exact test. c, d Boxplots comparing the RNA (c) and protein (d) levels of ERBB2 among HER2-0 (N = 88 for RNA and 34 for protein), HER2-low (N = 421 for RNA and 156 for protein) and HER2-positive (N = 181 for RNA and 64 for protein) tumors. The centerline represents the median, the box limits represent the upper and lower quartiles, the whiskers represent the 1.5× interquartile range, and the points represent individual samples. P values were computed using the two-sided Wilcoxon test. e Molecular landscape of HER2-low breast cancers stratified by hormone receptor (HR) status and HER2 IHC score. Genes marked with * and # represent genes differentially mutated between HER2 1+ and HER2 2+ patients in the HR-positive and HR-negative subgroups, respectively. Detailed criteria for gene screening and annotation are provided in the Methods. Source data are provided as a Source Data file.

