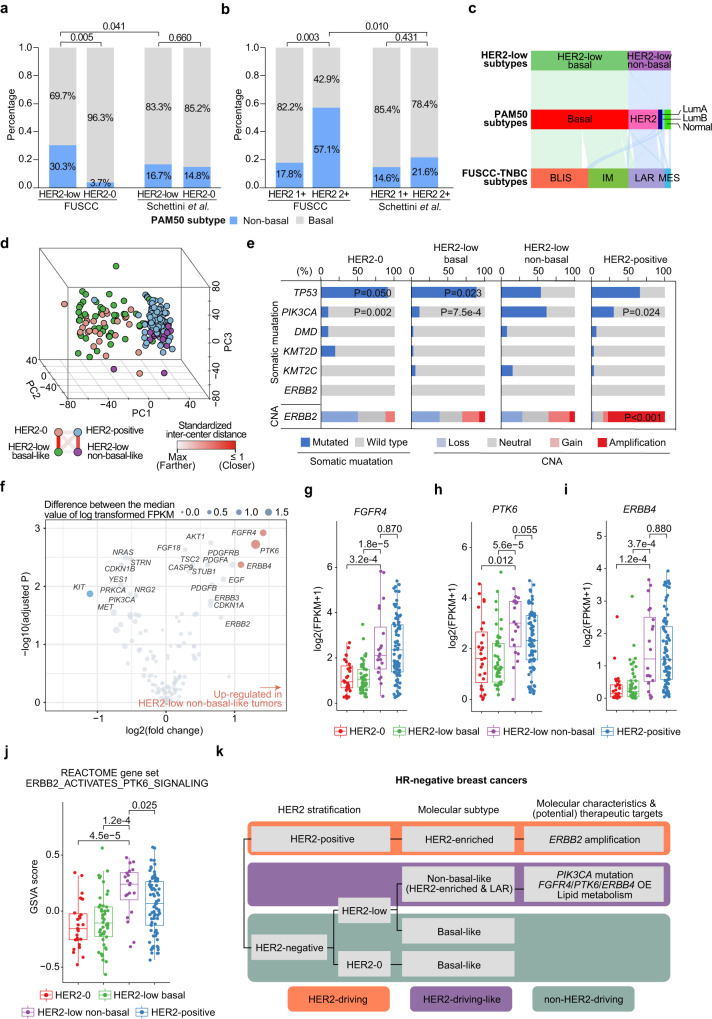
Fig. 4. Interpatient molecular heterogeneity of HR-negative HER2-low breast cancers.
a, b Bar plots comparing the proportion of non-basal-like tumors between the HER2-low and HER2-0 tumors (a) or between HER2 1+ and HER2 2+ ISH– tumors (b) in our FUSCC cohort and Schettini et al.’s cohort. P values were computed using the two-sided Fisher’s exact test. c Sankey diagram showing the classification of non-basal-like tumors in the PAM50 subtype and the FUSCC-TNBC subtype. d Principal component (PC) analysis of all protein-coding RNAs showing the relationship of HER2-0, HER2-low basal-like, HER2-low non-basal-like and HER2-positive tumors in HR-negative breast cancers. e Bar plots showing the somatic mutation rate of the top 5 genes within HR-negative breast cancers and genomic alterations of ERBB2 across the HER2 subgroups. The P values of genes that showed significant differences between HER2-low non-basal-like tumors and other subgroups are annotated. P values were computed using the two-sided Fisher’s exact test. f Dot plots showing the differentially expressed genes (DEGs) involved in PI3K and ERBB2 signaling between HER2-low non-basal-like and basal-like tumors. P values were computed using the two-sided Wilcoxon test and were adjusted for multiple testing using the false discovery rate method. Genes with abs2(log(fold change))>1 and adjusted P value < 0.05 were considered DEGs (colored blue or red). g–i Boxplot comparing the mRNA levels of FGFR4 (g), PTK6 (h) and ERBB4 (i) among the HER2-0 (N = 27), HER2-low basal-like (N = 46), HER2-low non-basal-like (N = 20) and HER2-positive (N = 81) subgroups. P values were computed using the two-sided Wilcoxon test. The centerline represents the median, the box limits represent the upper and lower quartiles, the whiskers represent the 1.5× interquartile range, and the points represent individual samples. j Boxplots comparing the enrichment score of REACTOME ERBB2 ACTIVATES PTK6 SIGNALING among the HER2-0 (N = 27), HER2-low basal-like (N = 46), HER2-low non-basal-like (N = 20) and HER2-positive (N = 81) subgroups. P values were computed using the two-sided Wilcoxon test. The centerline represents the median, the box limits represent the upper and lower quartiles, the whiskers represent the 1.5× interquartile range, and the points represent individual samples. k Schematic diagram of the molecular characteristics and driving mechanisms of HR-negative HER2-low breast cancers. BLIS basal-like and immune-suppressed, IM immunomodulatory, LAR luminal androgen receptor, MES mesenchymal-like, OE overexpression. Source data are provided as a Source Data file.

