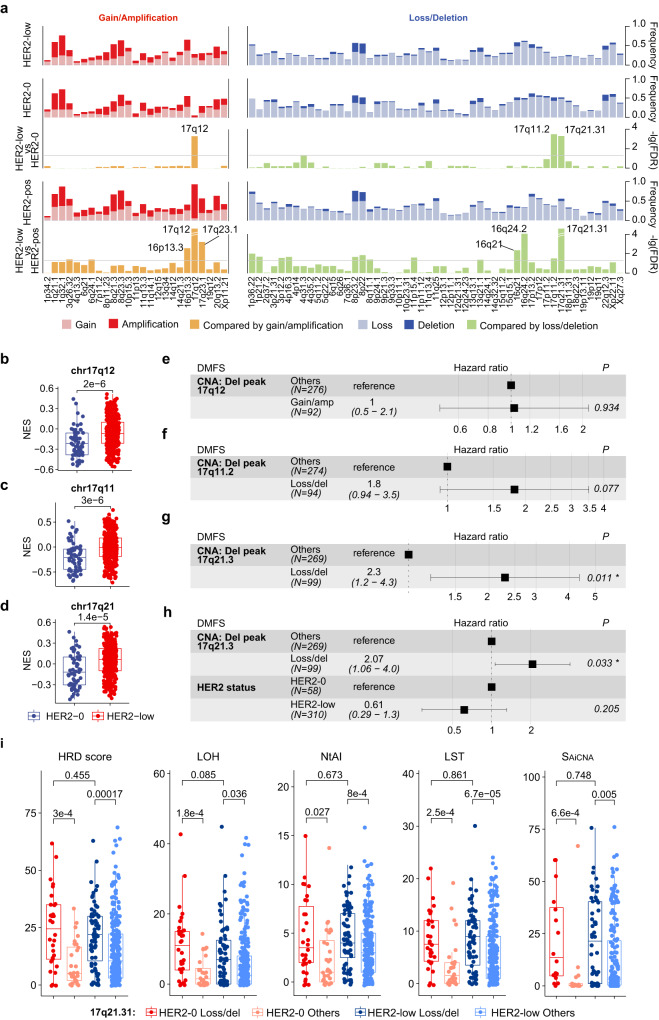
Fig. 5. Relation between molecular alterations and survival in HR-positive HER2-low breast cancer.
a Bar plots showing somatic copy number alteration (CNA) frequency and –log10(FDR) for comparison using an FDR-adjusted two-sided Fisher’s exact test between the HER2 status subgroups. The gray horizontal line in the comparison plots represents the level of –log10(0.05). b–d Gene set variation analysis (GSVA) scores of chr17q12 (b), chr17q11 (c) and chr17q21 (d) using the Molecular Signatures Database (MSigDB) C1 collection between HER2-0 (N = 61) and HER2-low (N = 355) breast cancers. P values were computed using a two-sided Fisher’s exact test. The centerline represents the median, the box limits represent the upper and lower quartiles, the whiskers represent the 1.5× interquartile range, and the points represent individual samples. e–g Forest plots showing the univariable Cox regression analysis for distant metastasis–free survival (DMFS) of the status of focal peaks 17q12 (e), 17q11.2 (f) and 17q21.31 (g) in HR-positive HER2-low breast cancers. Number (N) of patients belonging to each category is indicated. The association of all variables with prognosis was analyzed using a two-sided Cox proportional hazard regression analysis. Error bars represent the 95% confidence interval of the hazard ratio. h Forest plots showing the multivariable Cox regression analysis for distant metastasis–free survival (DMFS) of the status HR and the status of focal peak 17q21.31 in HR-positive HER2-low breast cancers. Number (N) of patients belonging to each category is indicated. The association of all variables with prognosis was analyzed using a two-sided Cox proportional hazard regression analysis. Error bars represent the 95% confidence interval of the hazard ratio. i Boxplots showing the genomic instability index related to 17q21.31 loss/deletion. The number (N) of HER2-0 loss/deletion, HER2-0 others, HER2-low loss/deletion and HER2-low others is 30, 28, 71 and 248. P values were computed using the two-sided Wilcoxon test. In boxplots, the centerline represents the median, the box limits represent the upper and lower quartiles, the whiskers represent the 1.5× interquartile range, and the points represent individual samples. Gain/amp gain/amplification, Loss/del loss/deletion. Source data are provided as a Source Data file.

