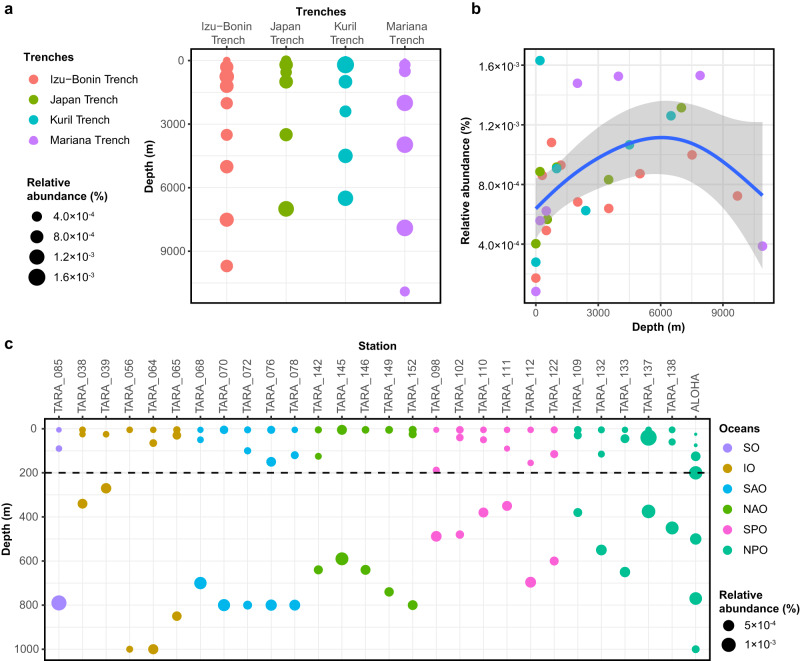
Fig. 6. Metagenome fragment recruitment to the JH545 genome.
a, c Relative abundances are plotted for various stations and depths from the four marine trenches with water depths of more than 6000 m (a) and station ALOHA and TARA Oceans stations (c). For TARA Oceans, only the stations with samples from water depths of both less than 100 m and more than 250 m were used. The dotted horizontal line in (c) indicates a depth of 200 m, the boundary between epipelagic (euphotic) and mesopelagic zones. Bubble colors in (c) correspond to the oceans where the sampling stations are located, following the legend at the right: SO, the Southern Ocean; IO, the Indian Ocean; SAO and NAO, the South and North Atlantic Ocean, respectively; SPO and NPO, the South and North Pacific Ocean, respectively. b Data used in (a) re-plotted to show the change in relative abundances as a function of depth. Regression line (in blue) and confidence intervals (95%; gray shading) were drawn by “geom_smooth” function of the ggplot2 R package with “gam” method (generalized additive model). Source data are provided as a Source data file.

