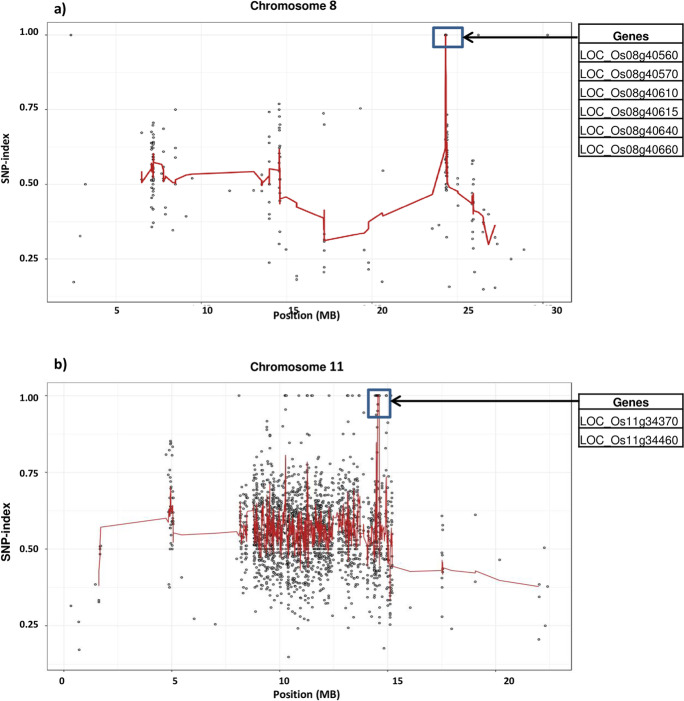
Fig. 3.
Genomic region (shown in rectangular shape) on a chromosome 8 and b chromosome 11 exhibiting for complete panicle exsertion. X-axis indicates the physical position of the chromosome, and the Y-axis indicates the average SNP-index. SNP index plot regression lines were obtained by averaging SNP indices from a moving window of five consecutive SNPs and shifting the window of one SNP at a time. The X-axis value of each averaged SNP index was set at a midpoint between the first and the fifth SNP

