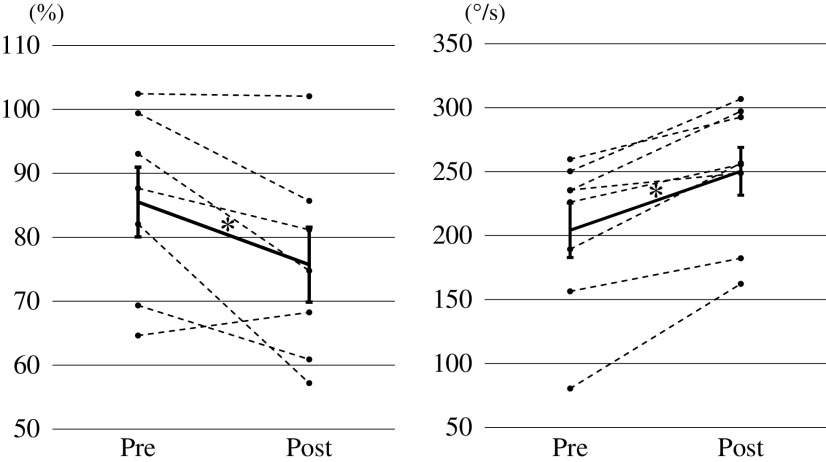
Fig. 2. Changes in D1 inhibition (left figure) and MAV of knee flexion (right figure) in the pendulum test.
The mean and standard error of the mean values are presented in bold lines and circles, and the dashed lines indicate changes in the values of each individual. Asterisks indicate significant differences (p <0.05).
MAV, maximum angular velocity

