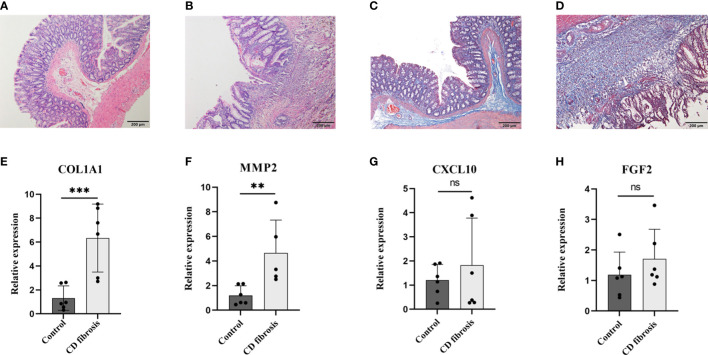
Figure 10.
Examination of biomarkers in CD fibrosis rats. Representative HE stained and Masson stained images in normal (A, C) and model groups (B, D), scale bar = 200µm. Statistical analysis of the expression levels of COL1A1、MMP2、CXCL10 and FGF2 in the control and model groups based on the RT-PCR assay (E–H). Control: blank control rats (n=6); CD fibrosis, Crohn’s disease fibrosis model group rats (n=6). Data are presented as the mean ± SD. **p< 0. 05, ***p< 0.01, ns, no significant difference.

