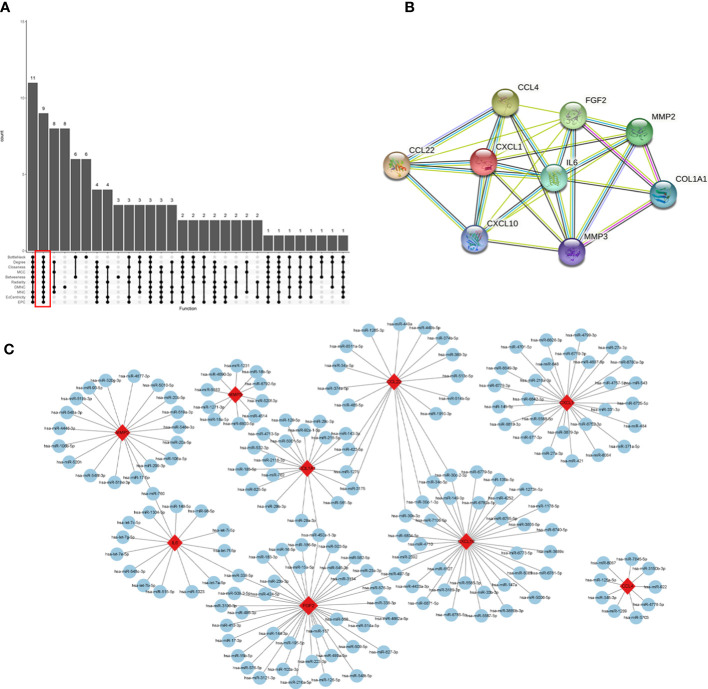
Figure 6.
Identification of hub genes and a co-expressed network of mRNAs and target miRNAs. Hub genes were screened by the R package “Upset” (A). Visualization the degree of interaction of 9 hub genes by STRING software (B). The mRNA-miRNA co-expressed network was constructed by Cytoscape including 181 nodes and 192 edges (C).

