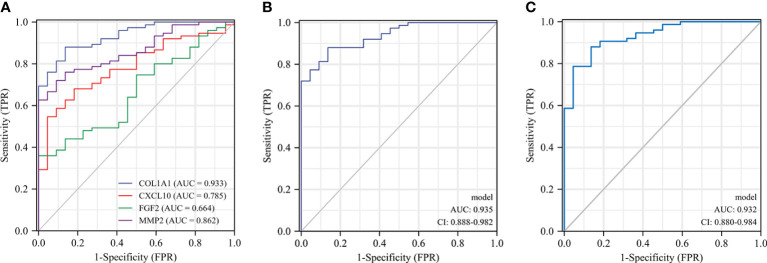
Figure 8.
ROC curves of the 4 specifically expressed hub genes. Diagnostic value of COL1A1、CXCL10、MMP2 and FGF2 in CD using non-inflammatory tissues as controls by dataset GSE75214 (A). Diagnostic value of COL1A1 and CXCL10 in CD (GSE75214 dataset) (B). Diagnostic value of COL1A1 and MMP2 in CD (GSE75214 dataset) (C).

