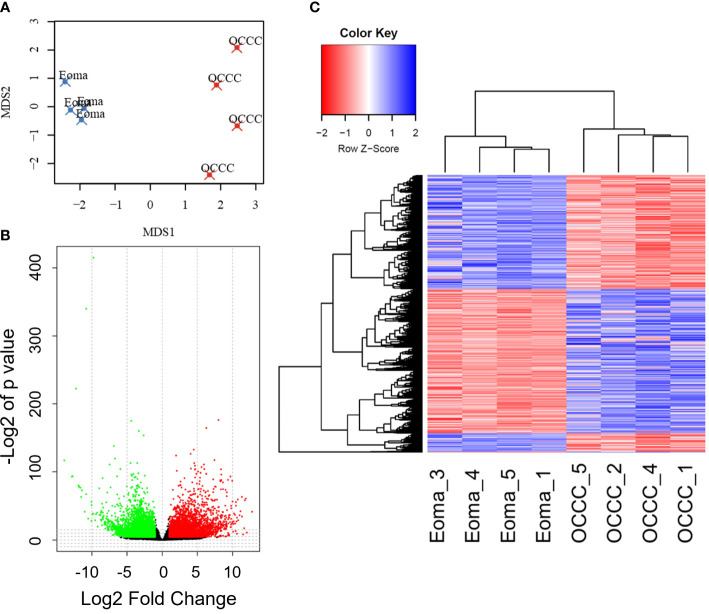
Figure 1.
The OCCC with concurrent endometriosis transcriptomic profile is molecularly distinct from benign endometrioma. (A) Multidimensional scaling (MDS) plot of transcriptomic profiles for endometrioma (Eoma, blue X’s) and ovarian clear cell carcinoma (OCCC, red X’s) with concurrent endometriosis. (B) Volcano plot representation of protein-coding transcripts overexpressed (red dots), similarly expressed (black dots), and under-expressed (green dots) in OCCC with concurrent endometriosis versus endometriomas (Padj <0.05; Log2-Fold change<|1|. (C) Heat map representation of 5575 differentially expressed unique protein-coding gene transcripts overexpressed (red) and under-expressed (blue). Dendrogram of hierarchical clustering. Rows, protein-coding gene transcripts; columns, profiled samples.

