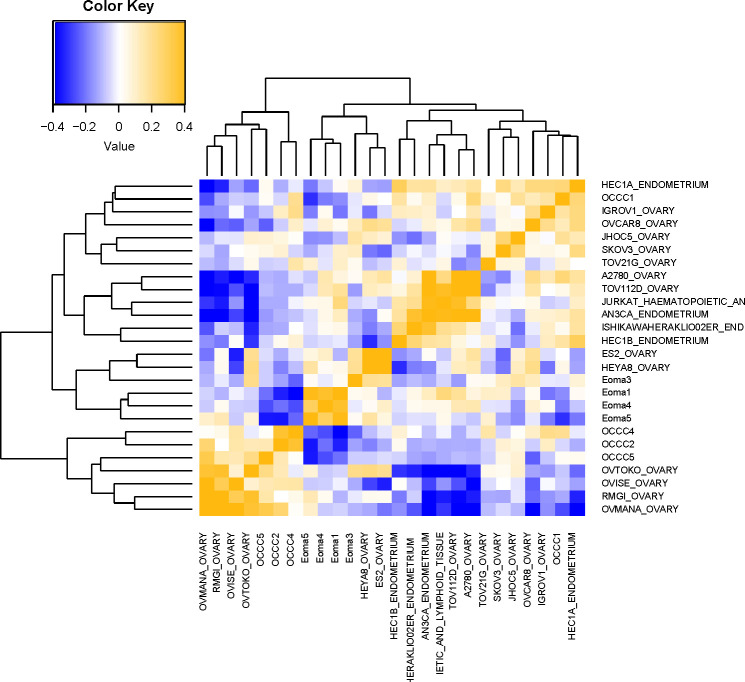
Figure 3.
Molecular comparison of cell line transcriptomic profiles with clinical samples. Computational analysis of the molecular similarity of the clinical samples (Eoma, benign endometrioma or OCCC, OCCC with concurrent endometriosis) and cell lines from CCLE. A pathway activation score (PAS) was first computed for each pathway and each sample. Then the similarity between the samples was assessed by Pearson Correlation Coefficients (PCC) of the PAS. Cell line nomenclature is the CCLE name of the line_tissue type. A yellow color represents a higher PCC; blue, a lower PCC.

