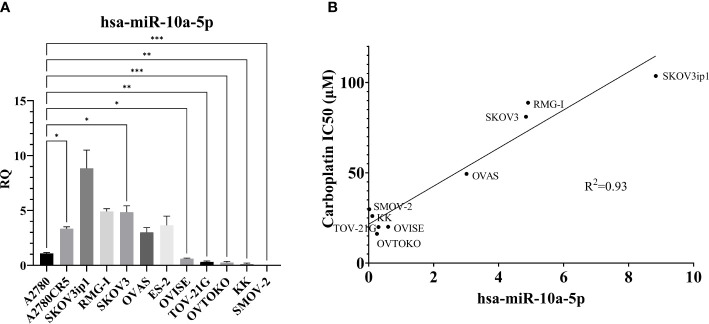
Figure 6.
MiR-10a-5p expression across a panel of ovarian cancer cell lines. (A) RQ, the relative quantity of hsa-miR-10a-5p to U6 snRNA, normalized to A2780. ***P<0.001, **P<0.001, *P< 0.05, Brown-Forsythe and Welch ANOVA. A2780 (n = 6), A2780CR5 (n = 2), SKOV3ip1 (n = 3), RMG-I (n = 2), SKOV3 (n = 4), OVAS (n = 4), ES-2 (n = 4), OVISE (n = 9), TOV-21G (n = 4), OVTOKO (n = 7), KK (n = 3), and SMOV-2 (n = 6). (B) Correlation of miR-10a-5p expression to carboplatin IC50 in OCCC cell lines. RMG-I (n = 2), OVAS (n = 4), ES-2 OVISE (n = 9), TOV-21G (n = 2), OVTOKO (n = 7), KK (n = 2), and SMOV-2 (n = 6). Carboplatin IC50 is n ≥ 5 for each cell line.

