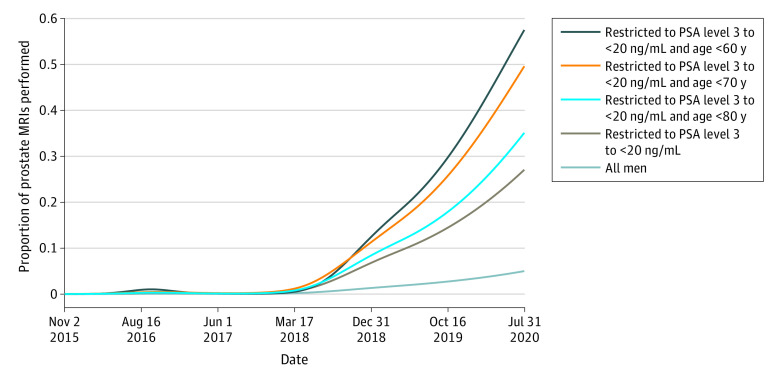
Figure 1. Use of Prostate Magnetic Resonance Imaging (MRI) Over Time.
Graph shows proportion of MRIs performed as a function of the first prostate-specific antigen (PSA) value on November 1, 2015, to July 31, 2020, for all men, and for men with PSA between 3 and less than 20 ng/mL according to age groups. To convert PSA to micrograms per liter, multiply by 1.

