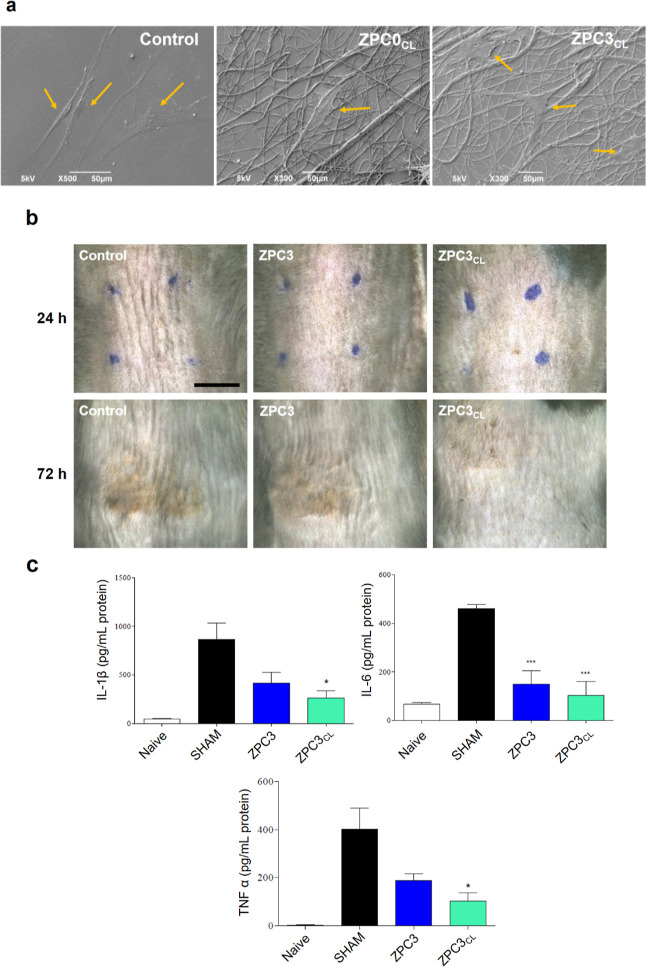
Figure 6.
(a) Direct plating of the HDFa cells onto glass coverslips (control), ZPC0CL, and ZPC3CL microfibers. Orange arrows indicated the HDFa cells. (b) Photographs of the mice UVB-burned skin after 24 and 72 h of treatment with ZPC3 and ZPC3CL microfibers. The blue dots show the application area of the plant-based patches on the mice skin. Scale bar of 0.5 mm. (c) ELISA measurements for the quantification of the cytokines IL-1β, IL-6, and TNF-α expression in the mice skin burned area. Asterisks represent statistical significance with respect to the control, SHAM samples (*p < 0.05 and ***p < 0.001).

