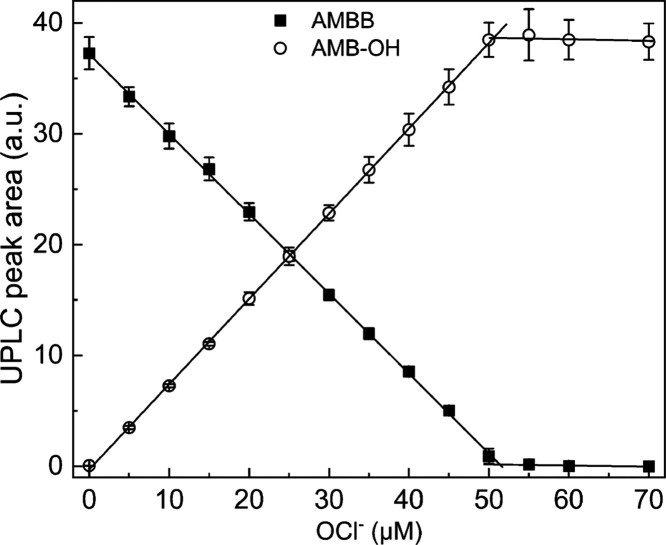
Figure 3.
Stoichiometry of the AMBB and HOCl reaction. UPLC peak areas of AMBB (solid squares, 50 μM) and AMB-OH (open circles) as a function of sodium hypochlorite concentration in aqueous phosphate buffer (20 mM, pH 7.4). UPLC peak areas were integrated for chromatograms extracted at 250 ± 1.2 nm. Points represent means ± S.D. for three independent measurements.

