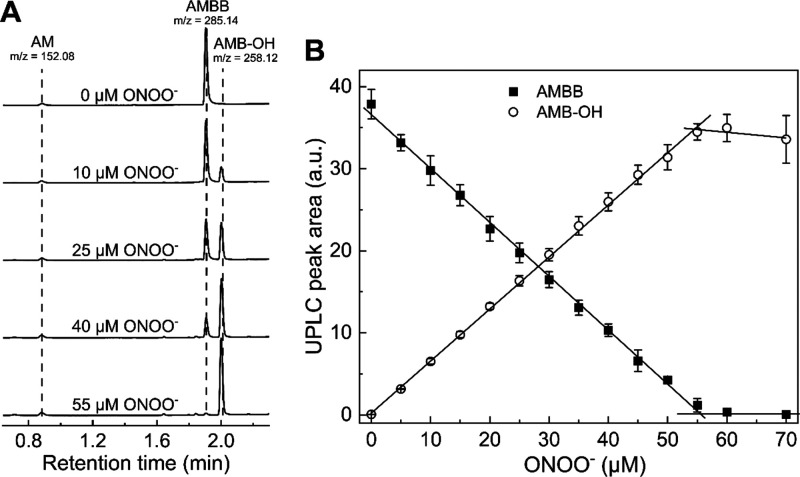
Figure 5.
UPLC-MS analyses of the AMBB and ONOO– reaction mixtures. (A) UPLC traces of samples containing 50 μM AMBB, various concentrations of ONOO– (0–50 μM), and 20 mM phosphate buffer (pH 7.4). Samples were analyzed immediately (<2 min) after mixing. UPLC traces were extracted at 250 ± 1.2 nm. m/z values for [M + H]+ ions were obtained using a TOF-MS detector (see Supporting Information). (B) Stoichiometry of AMBB and ONOO– reaction. UPLC peak areas of AMBB (solid squares, 50 μM) and AMB-OH (open circles) as a function of ONOO– concentration in aqueous phosphate buffer (20 mM, pH 7.4). UPLC peak areas were integrated for chromatograms extracted at 250 ± 1.2 nm. Points represent means ± S.D. for three independent measurements.

