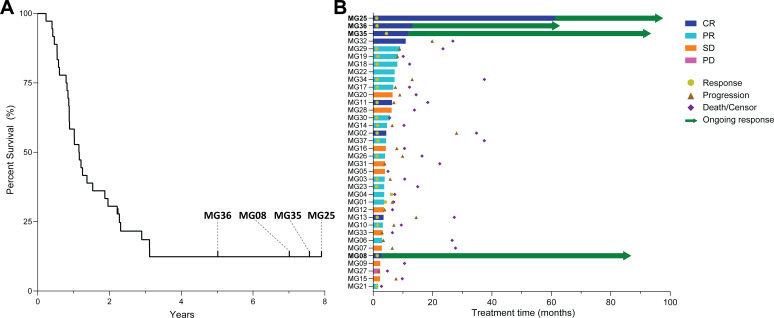
Figure 1.
Long-term follow-up reveals a subset of extraordinary responders after treatment with cisplatin-based chemotherapy and ipilimumab. (A) Kaplan-Meier survival curve with the four DDFTFS patients labeled (MG36, MG08, MG35, MG25). (B) Swimmer plot indicating the duration of treatment, clinical response, and time of progression, death/censor, or ongoing response, with DDFTFS patients bolded. CR, complete response; DDFTFS, durable disease-free treatment-free survival; PD, progressive disease; PR, partial response; SD, stable disease.

