
Figure 1: Agreement between ELISA and SomaScan® measurements for key angiogenic and anti-angiogenic proteins.
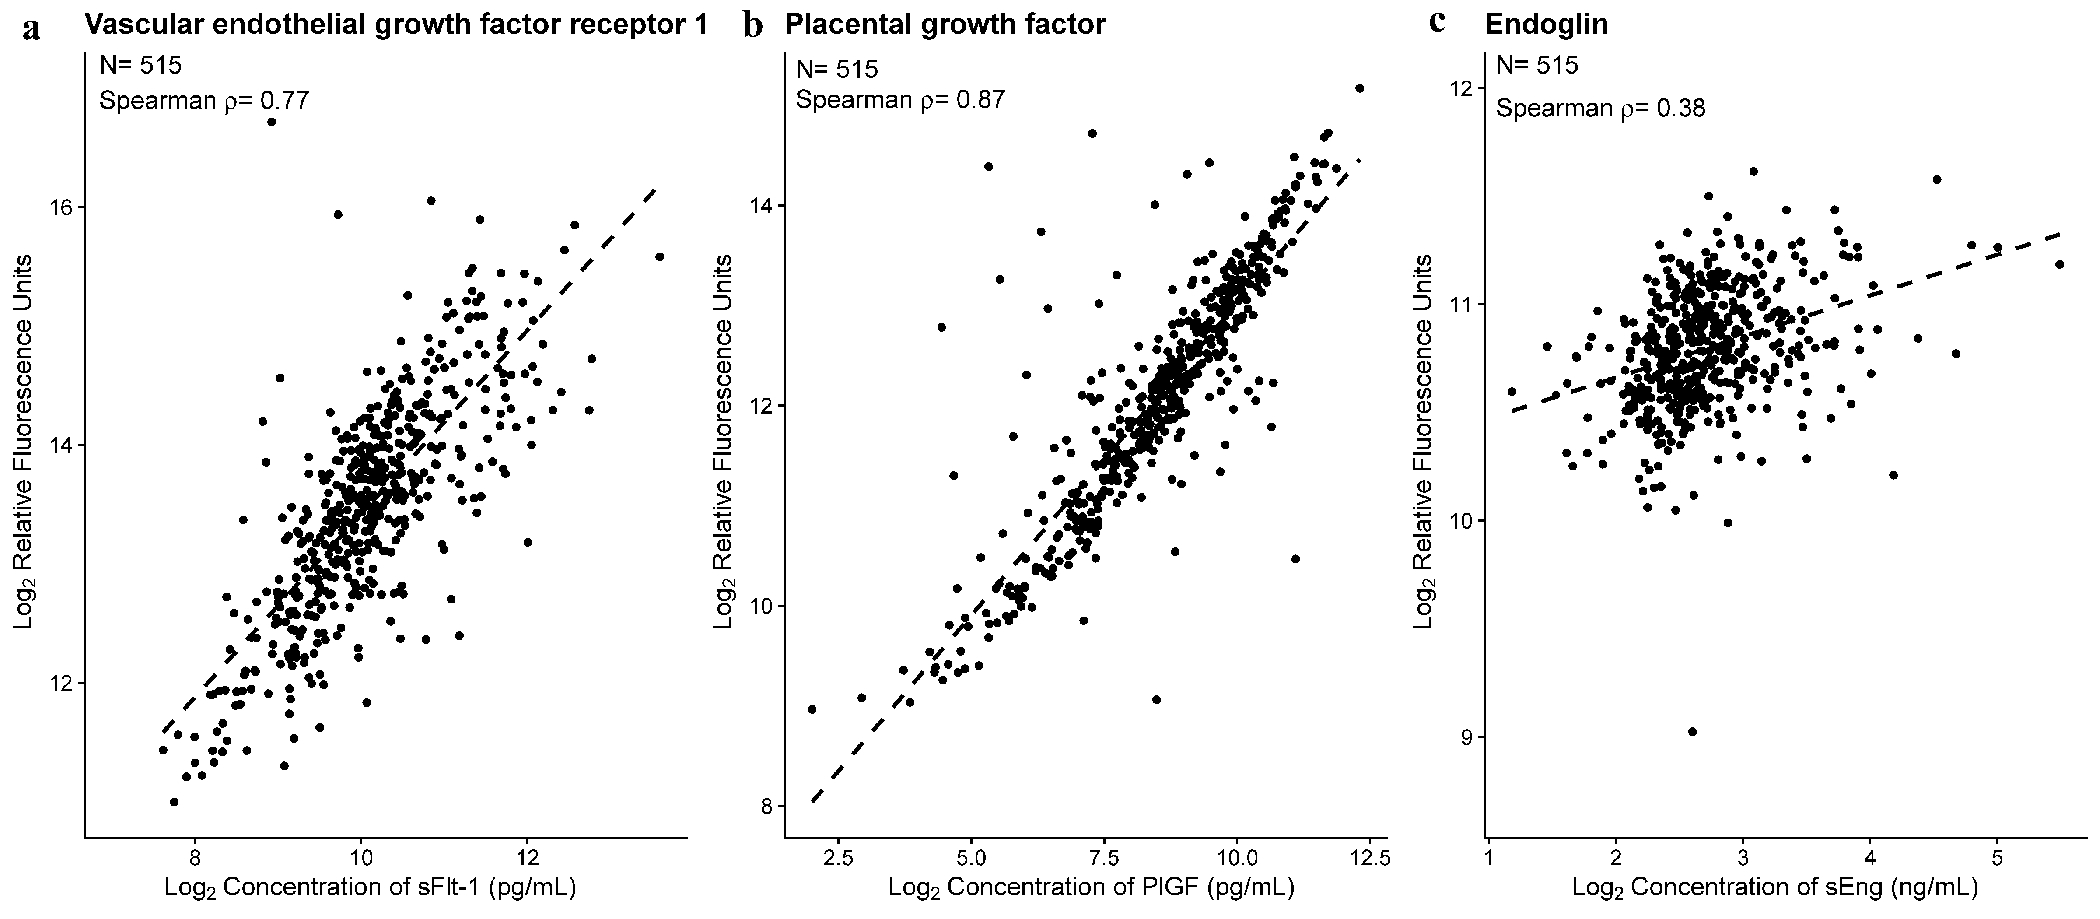
Protein abundance for 515 samples are shown, with one dot for each sample. The SomaScan relative fluorescence units in (log, base 2) (y-axis) is shown vs. ELISA based concentrations (log, base 2) (x-axis) for sFlt-1 (A), PlGF (B) and sEng (C). ρ is the Spearman’s correlation coefficient. Correlation test p<0.001 for all three proteins.