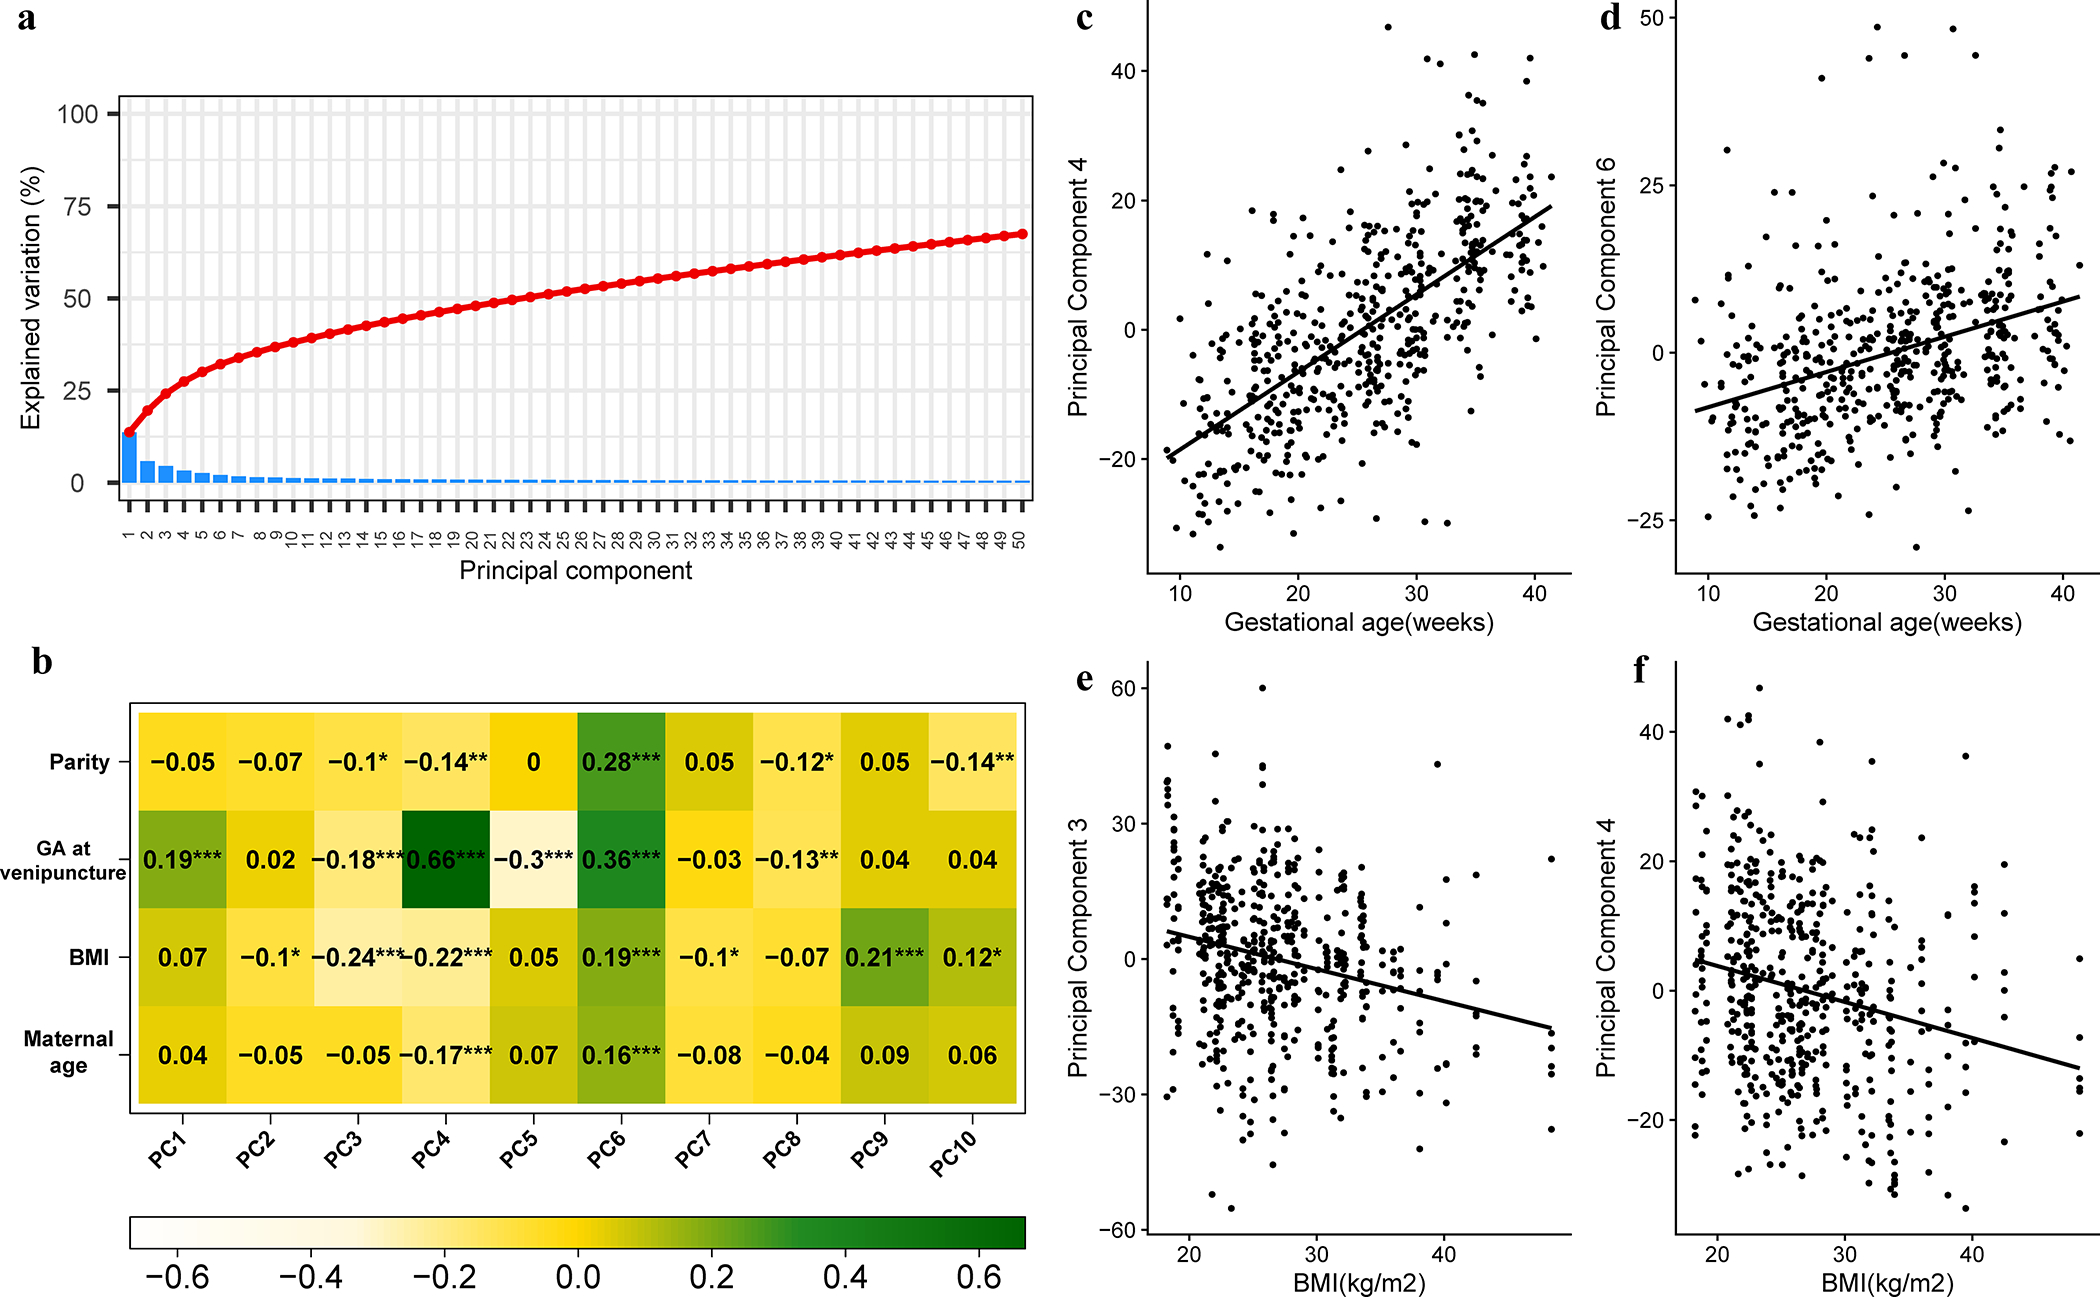
Figure 2: Principal component analysis of 6,277 proteins and correlation with gestational age and maternal characteristics.

Protein abundance in relative fluorescence units (log, base 2) was analyzed using principal components (PC) analysis. The resulting principal components can be understood as meta-proteins. A) The % of variance explained by each principal component is shown as a scree plot. (B) The top 10 principal components were correlated with maternal age, parity, gestational age (GA) and body mass index (BMI). The heatmap shows Pearson correlation coefficients between PC and covariates (significance levels: *<0.05, **<0.01, ***<0.001). The correlation between PC4 (C) and PC6 (D) with gestational age is also shown, with each dot representing one sample. Similar correlations are shown for PC3 (E) and PC4 (F) in relation with BMI.
