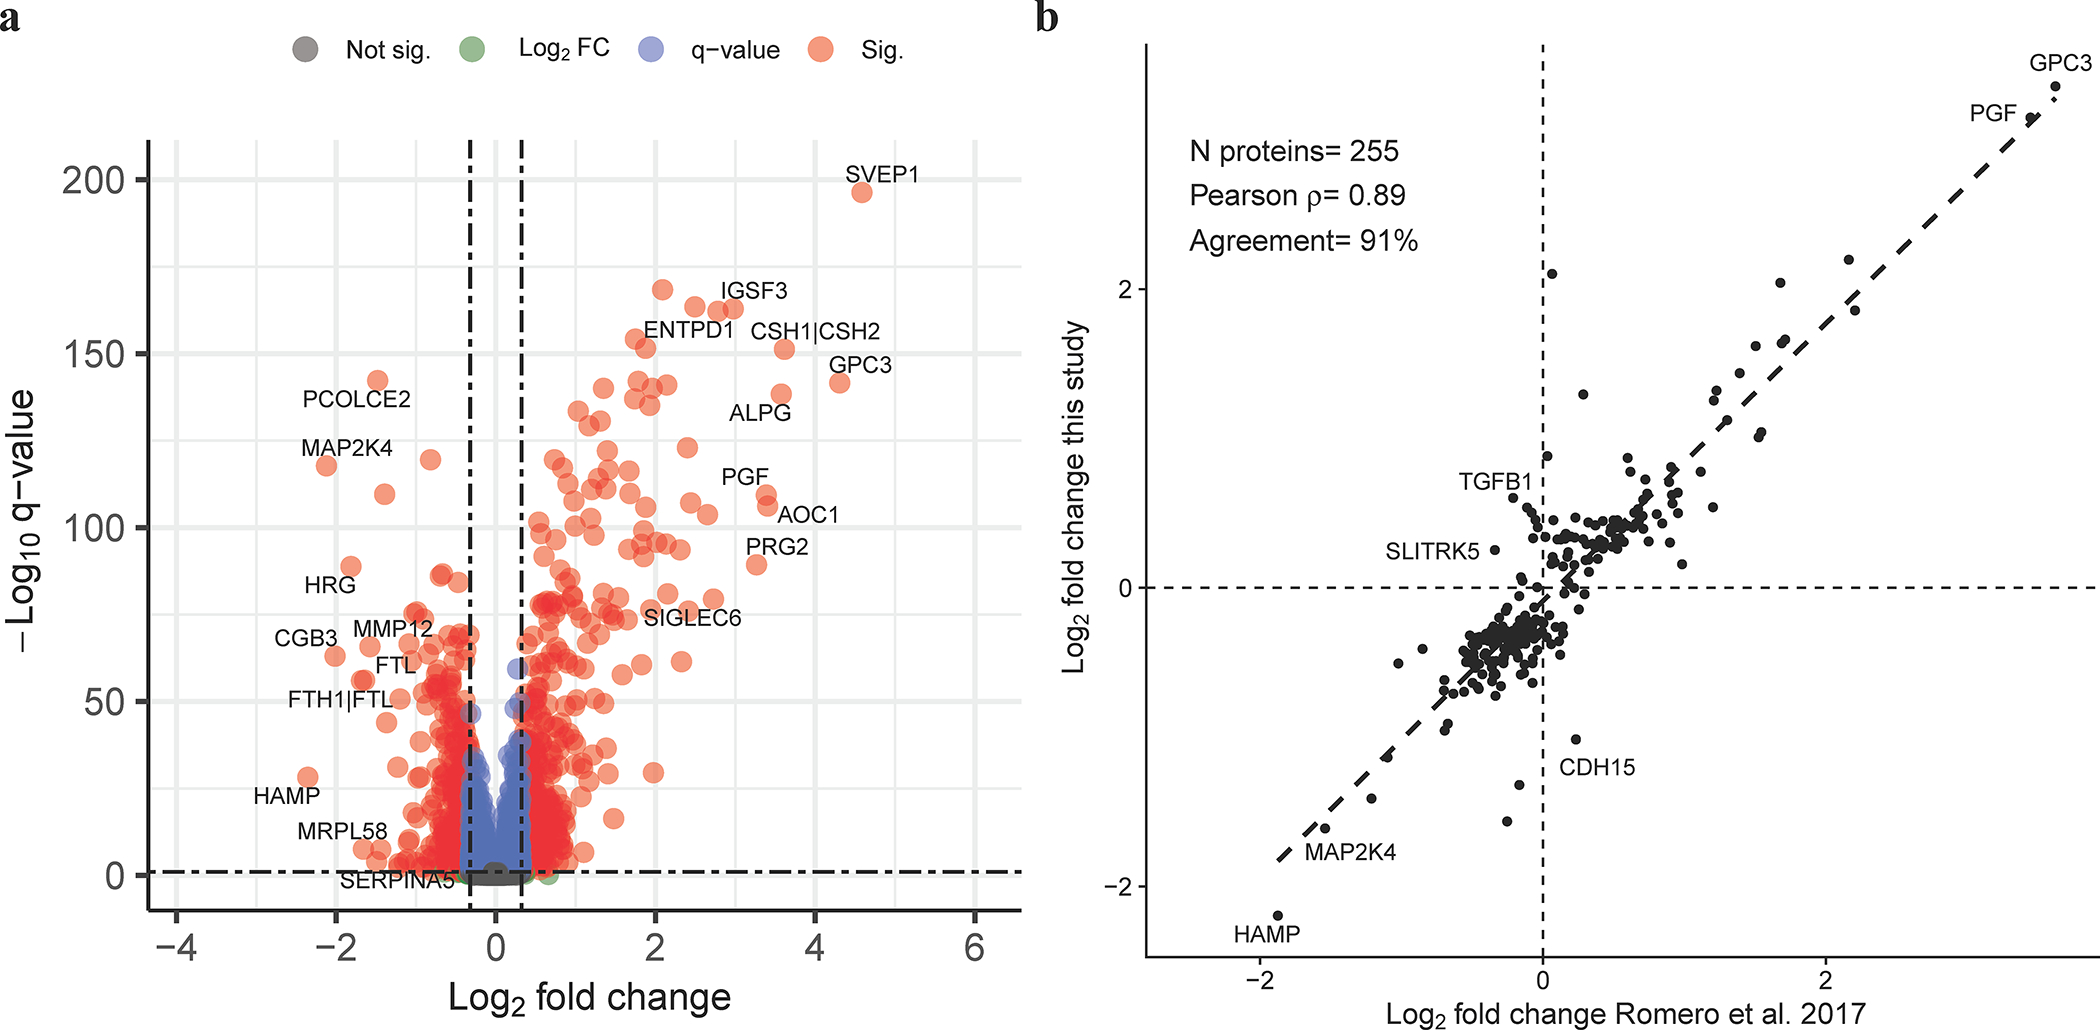
Figure 3: Proteomic changes with advancing gestation in normal pregnancy.

The volcano plot (A) shows the significance (y-axis) vs. magnitude of change (x-axis) for each protein. Protein with significant modulation (adjusted p-value, q <0.1 and fold change >1.25, N=953 proteins) are shown in red. The names of a select set of most significant proteins are also displayed. The correlation between fold changes (log, base 2) from 10 weeks to 32 weeks of gestation and similar results based on Romero et al. 2017 study is shown for 255 proteins deemed significant in this study and profiled in Romero et al. 2017 using SomaScan® platform v3. The gene symbols of the top increased and decreased proteins with concordant direction of change between studies are listed in the figure. The same is true for top three proteins with the most discordant fold change between studies.
