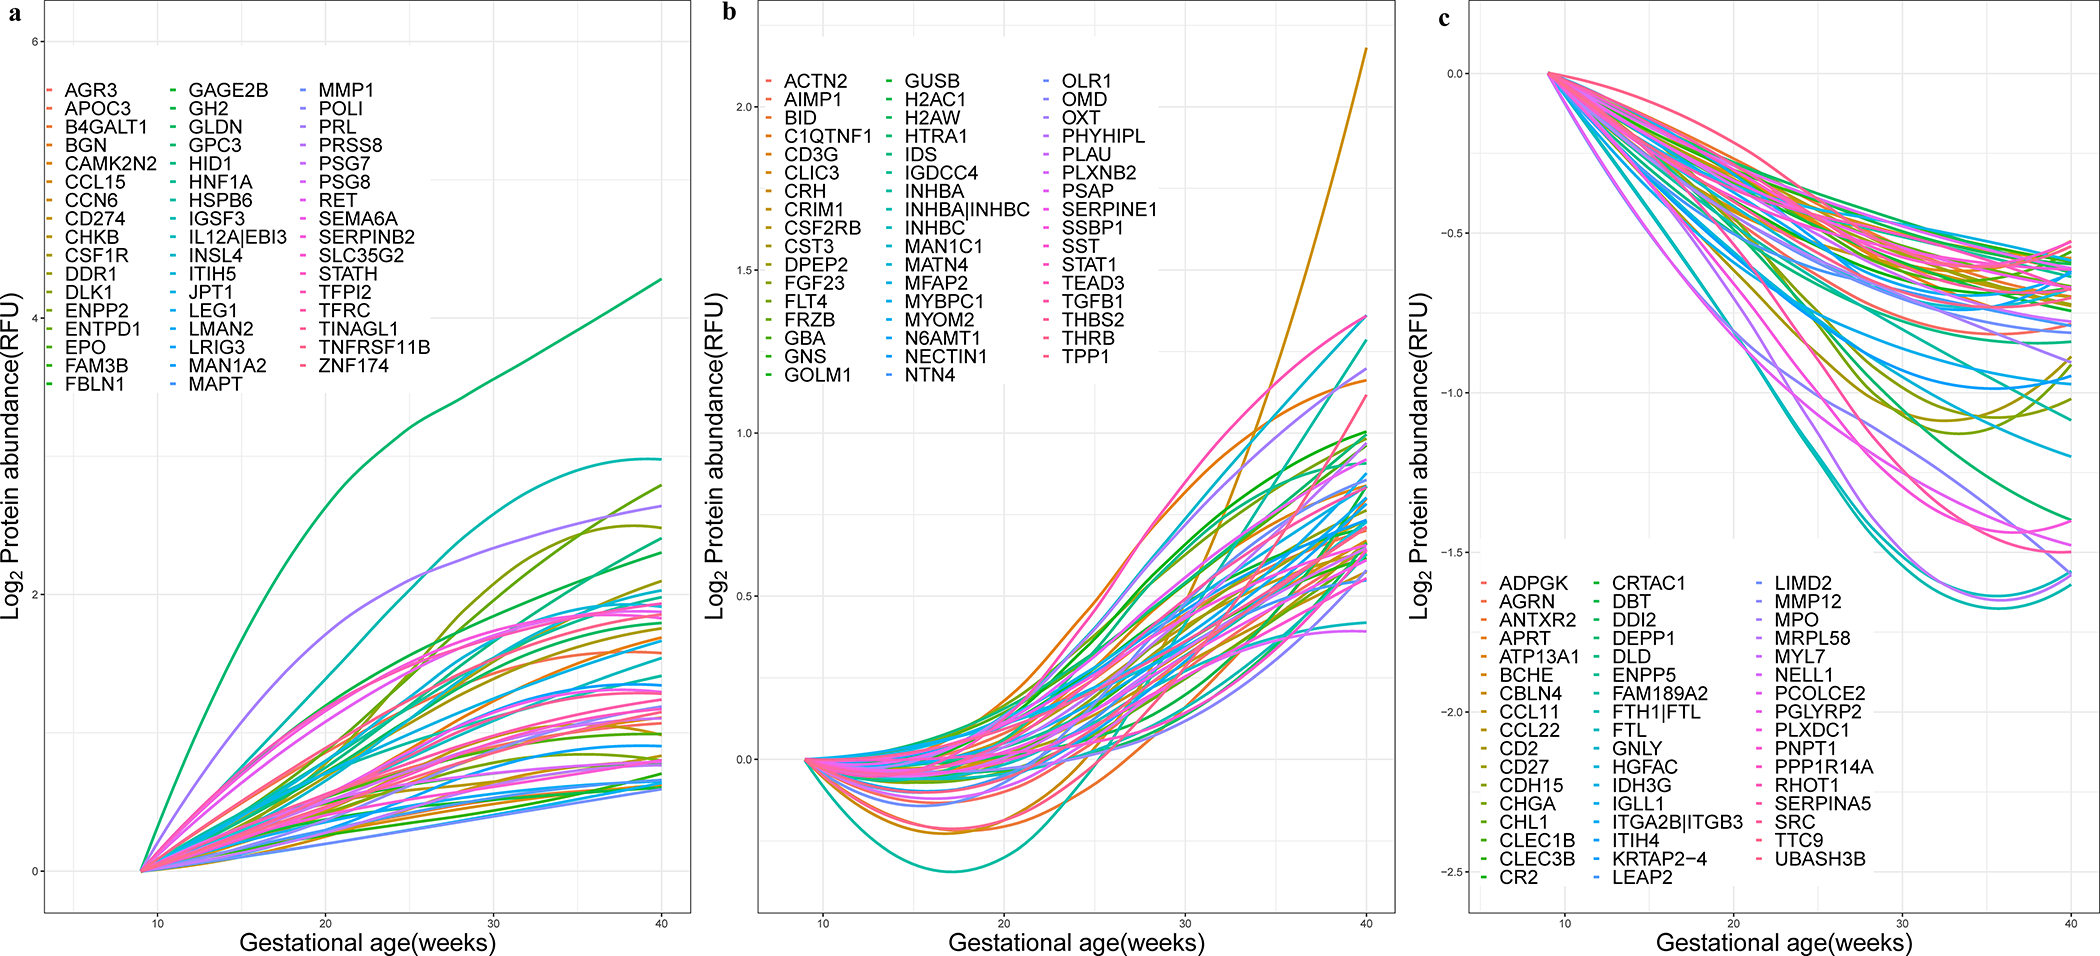
Figure 4: Maternal plasma proteomic trajectories throughout gestation.

The figure shows three clusters of proteins with steady increase (A), slow increase or decrease early in pregnancy followed by an increase later in pregnancy (B), and overall decreasing trend (C). The 50 proteins most representative of each cluster are shown, with names displayed representing corresponding gene symbols. See Supplementary File 2 for a depiction of the raw data used to derive the protein trajectories for selected proteins.
