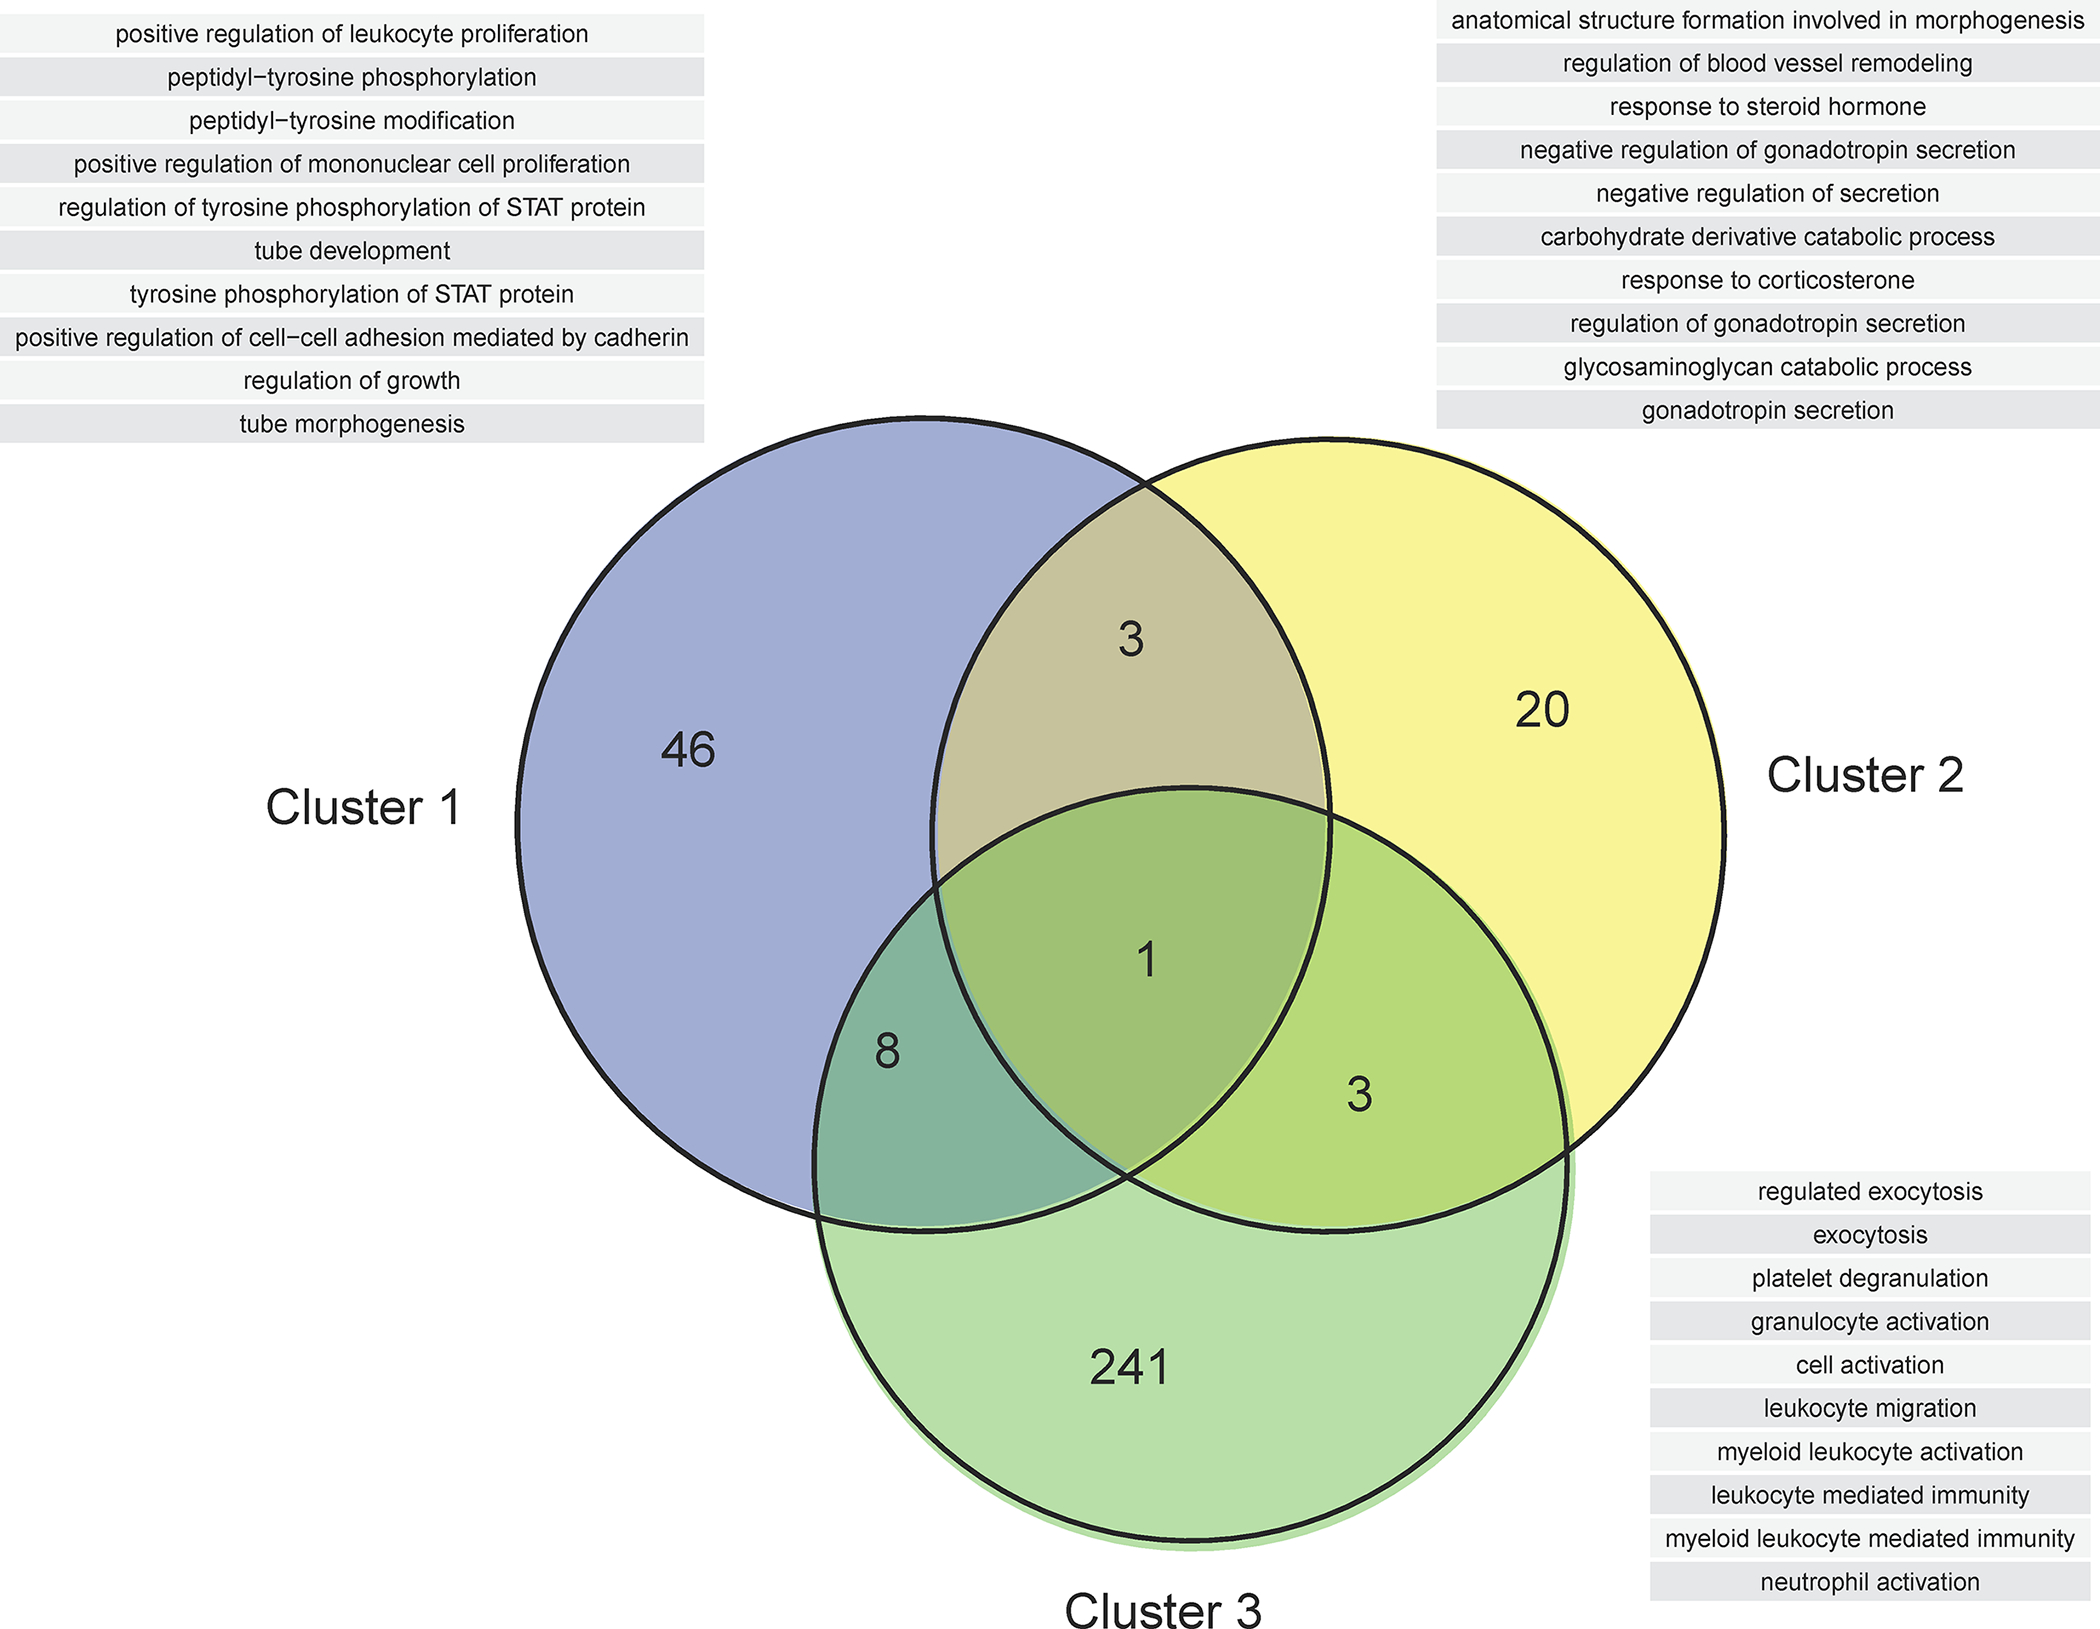
Figure 5: Biological processes associated with maternal plasma protein modulation with gestational age.

The Venn diagram shows the overlap in biological processes significantly associated with differentially modulated proteins for each cluster illustrated in Figure 4. See also Supplementary File 3 for the full list of biological processes associated with gestational age modulation. The list of the top 10 biological processes (ranked by enrichment p-value) for each Venn diagram category is shown in a table.
