An official website of the United States government
Here's how you know
Official websites use .gov
A
.gov website belongs to an official
government organization in the United States.
Secure .gov websites use HTTPS
A lock (
) or https:// means you've safely
connected to the .gov website. Share sensitive
information only on official, secure websites.
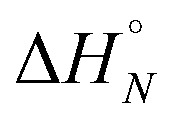
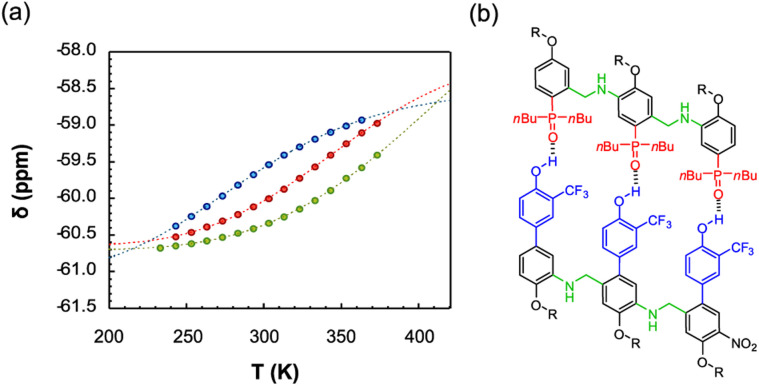
 are 289 K and −23 kJ mol−1 for A·D, 354 K and −33 kJ mol−1 for AA·DD, and 422 K and −34 kJ mol−1 for AAA·DDD. (b) Structure of the AAA·DDD duplex.