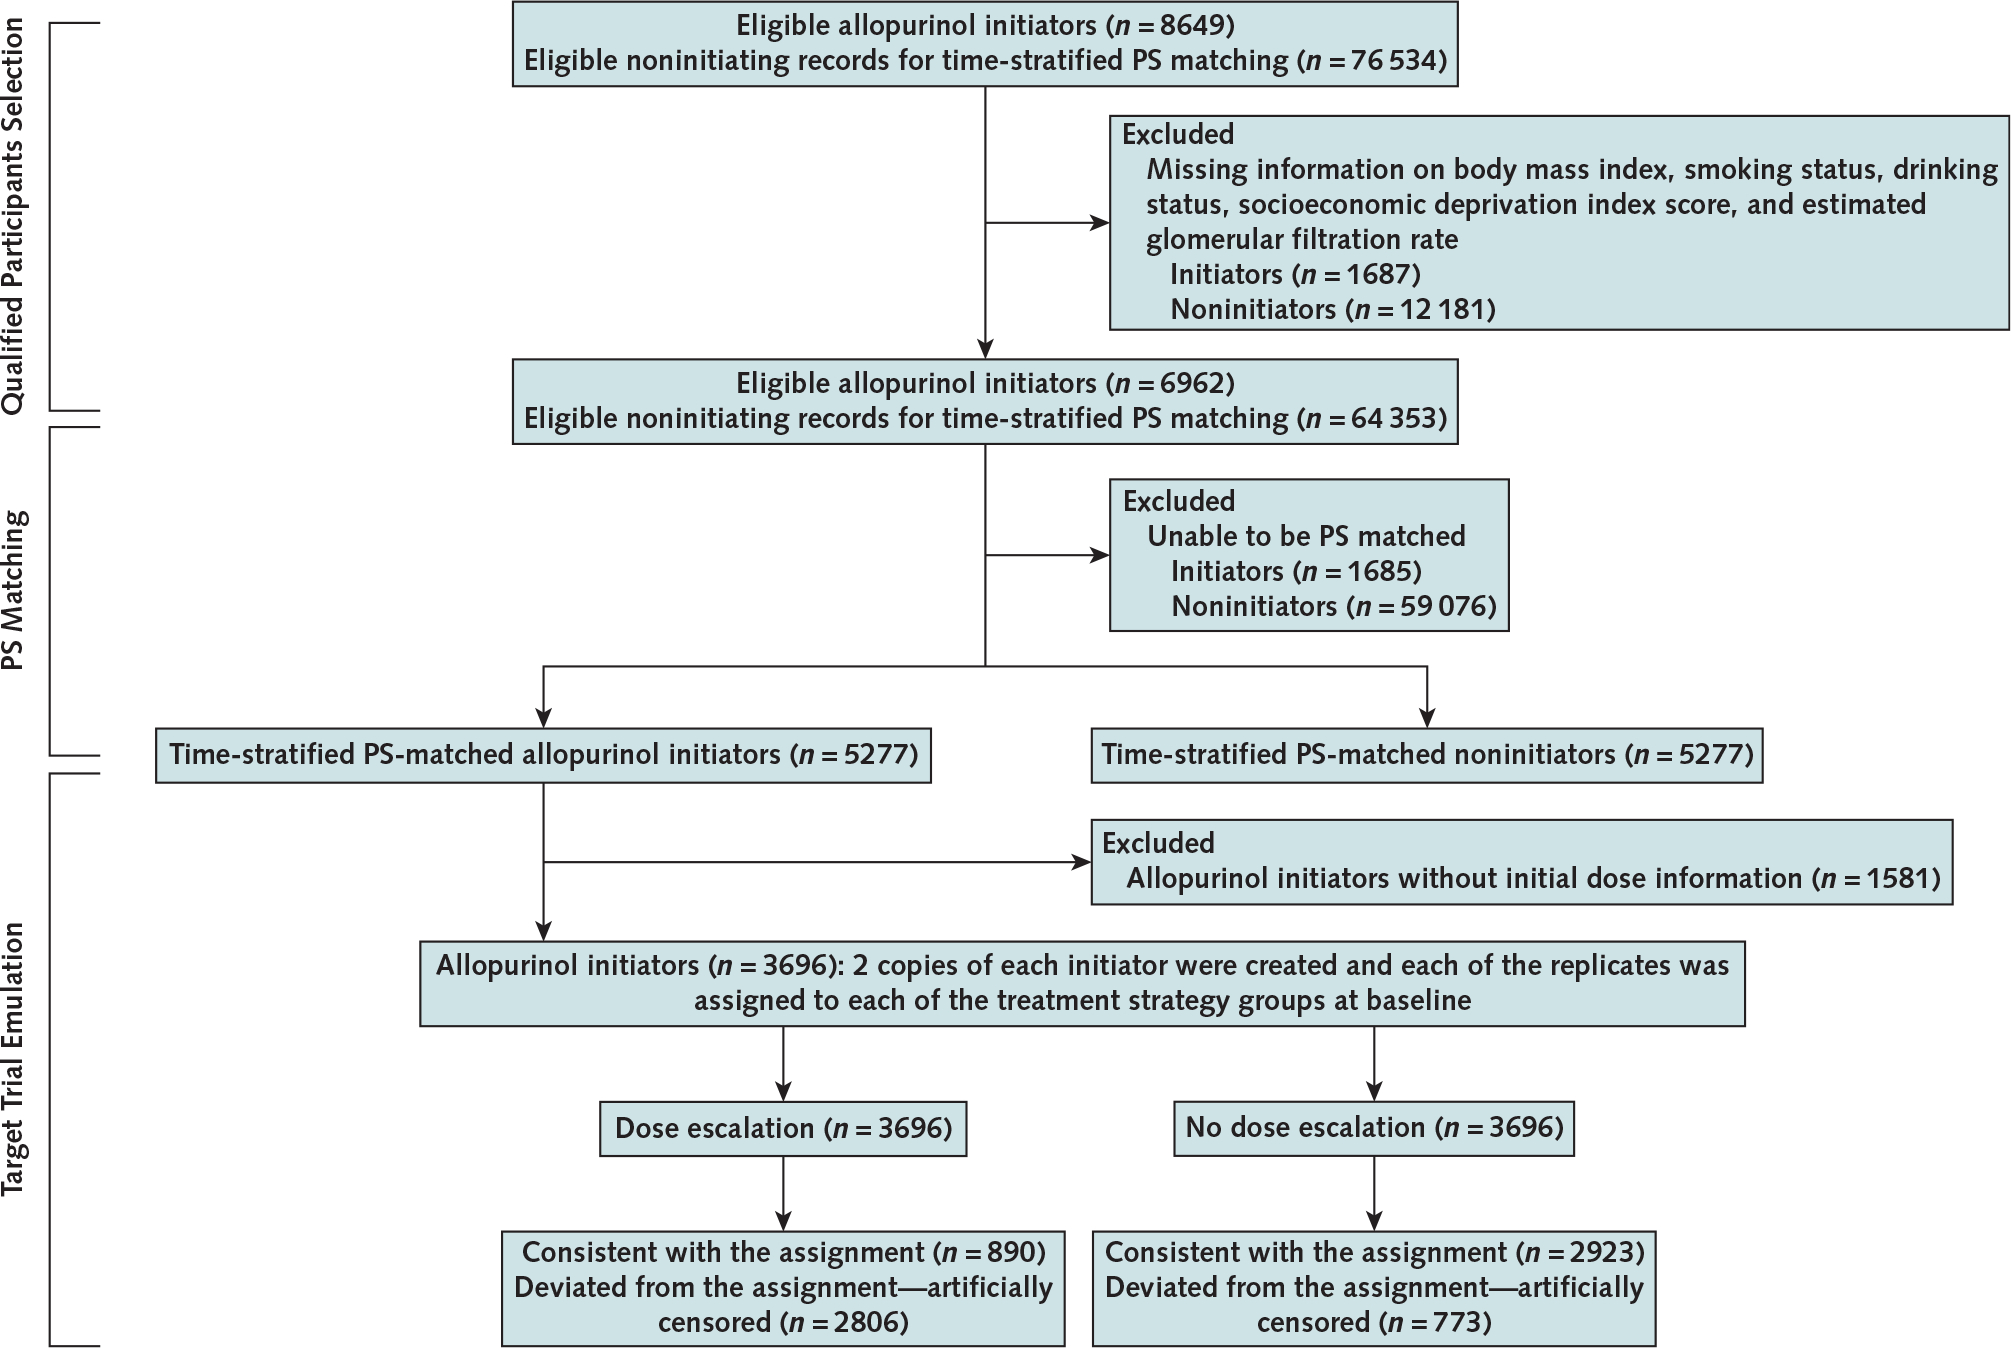
Appendix Figure 1.

Flow chart of eligible persons for examining the relation of allopurinol initiation and allopurinol dose escalation to all-cause mortality, THIN 2000 to 2019.
PS = propensity score; THIN = The Health Improvement Network.

Flow chart of eligible persons for examining the relation of allopurinol initiation and allopurinol dose escalation to all-cause mortality, THIN 2000 to 2019.
PS = propensity score; THIN = The Health Improvement Network.